31 of 43 San Francisco Condos Closed Above Asking in September 2026, with Median at $1.55M
Forty-three condominiums closed across San Francisco in September 2026, the only segment recorded. Seventy-two percent of sales landed above list price, with one Bush Street unit finishing 37.3 percent over ask and another on Rosemont Place clearing its list by 46.1 percent.
The period at a glance
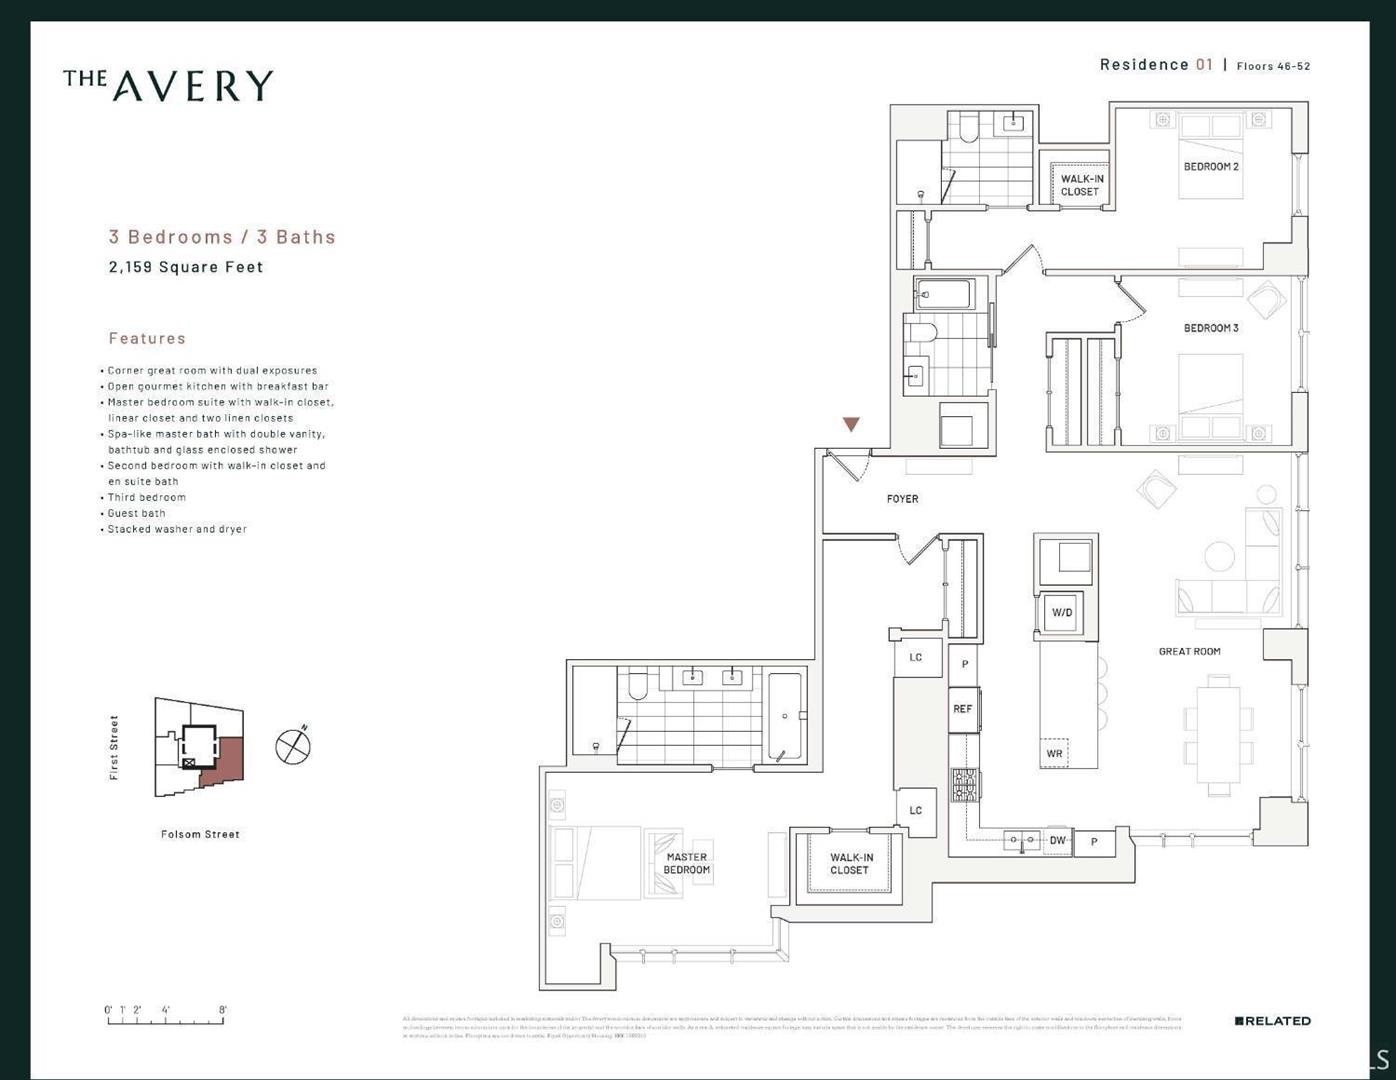
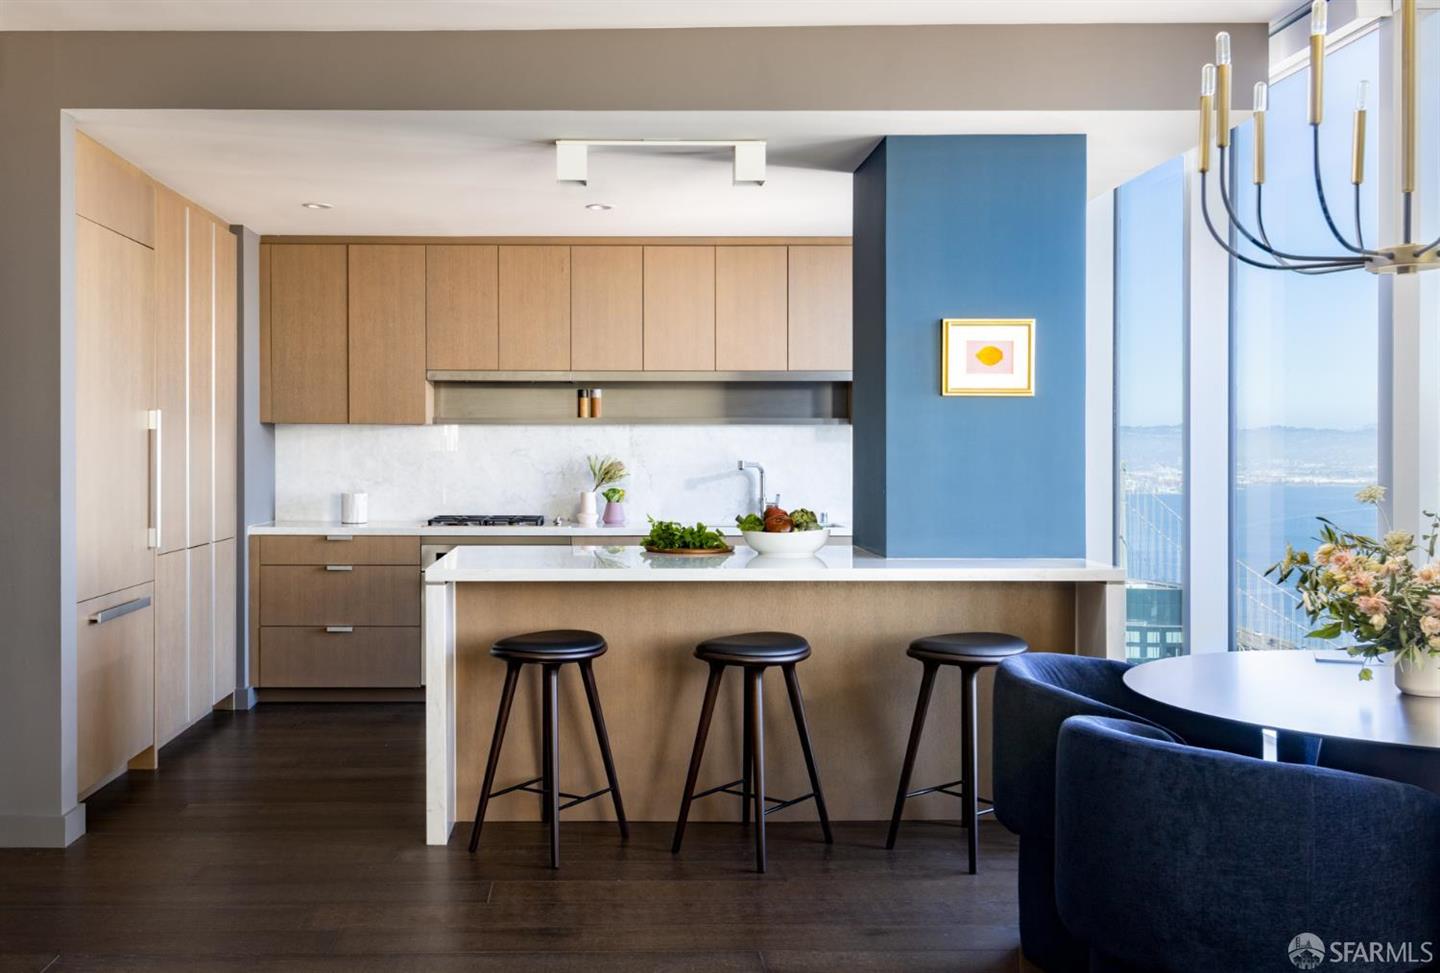
The most arresting fact in September's closing record is not the top sale — a 49th-floor unit at 488 Folsom that settled at $4.922 million — but the volume of sales that finished well above list at the middle of the market. Twelve transactions closed between $1.5 million and $2 million, and several of them carried premiums that would have seemed implausible two years ago. Days on market were recorded for zero of the 43 closings, so no speed analysis is possible. No year-over-year comparison can be made; the source carries no confirmed closings for September 2025.
| Metric | September 2026 |
|---|---|
| Closings | 43 |
| Total volume | $69,525,000 |
| Median sale price | $1,550,000 |
| Median price per sq ft | $1,205 |
| Median interior size | 1,212 sq ft |
| Price range | $585,000 – $4,922,000 |
| Closed above list | 31 (72%) |
| Closed at list | 3 (7%) |
| Closed below list | 9 (21%) |
| Median sale-to-list ratio | 107.8% |
| Largest premium | +46.1% (35 Rosemont Place) |
| Largest discount | -7.1% |
All 43 recorded closings were condominiums — no single-family, TIC, or multi-unit transactions appear in the source data for the month. The median sale price of $1.55 million sat roughly $67,000 above the mean active list price of $1,195,000 currently showing in inventory, a gap that reflects both the month's mix and the concentration of closings in the $1.5M–$2M band. The mean sale price of $1,616,860 ran modestly above the median, pulled upward by the handful of closings north of $3 million.
Seventy-two percent of the 43 sales closed above their list price, and the median sale-to-list ratio landed at 107.8 percent. That ratio is not uniform across the price spectrum — as the segment and band tables below show, the over-ask pattern was concentrated in specific pockets rather than spread evenly.
The sales
The table below shows all 43 closings — this is the complete roster for the month, not a top-40 subset.
| Address | Beds | Baths | Sq Ft | Sale Price | $/SF | % of List | Closed |
|---|---|---|---|---|---|---|---|
| 488 Folsom St #4901 | 3 | 3 | 2,159 | $4,922,000 | $2,280 | 98.4% | Sep 26 |
| 756 Chestnut St | 3 | 4 | 2,262 | $3,500,000 | $1,547 | 120.9% | Sep 29 |
| 2211 Scott St | 3 | 2 | 1,930 | $3,300,000 | $1,710 | 104.8% | Sep 28 |
| 2254 Bush St | 3 | 3 | 1,785 | $3,000,000 | $1,681 | 137.3% | Sep 25 |
| 1998 Broadway St #405 | 3 | 3 | 1,390 | $2,450,000 | $1,763 | 122.8% | Sep 30 |
| 1035 Fell St | 4 | 2 | 2,054 | $2,300,000 | $1,120 | 104.8% | Sep 17 |
| 27 Ford St | 2 | 2 | 1,423 | $2,200,000 | $1,546 | 122.6% | Sep 23 |
| 1376 Florida St | 3 | 3 | 1,524 | $2,180,000 | $1,430 | 136.4% | Sep 25 |
| 401 Harrison St #26C | 2 | 2 | 1,334 | $1,995,000 | $1,496 | 100.0% | Sep 17 |
| 235 Berry St #115 | 3 | 3 | 1,910 | $1,975,000 | $1,034 | 101.3% | Sep 29 |
| 650 Delancey St #203 | 2 | 2 | 1,619 | $1,950,000 | $1,204 | 92.9% | Sep 17 |
| 616 Broderick St | 3 | 1 | 1,657 | $1,850,000 | $1,116 | 109.1% | Sep 29 |
| 758 Haight St #3 | 2 | 1 | 1,148 | $1,800,000 | $1,568 | 128.7% | Sep 30 |
| 1727 Grove St | 2 | 2 | 1,165 | $1,700,000 | $1,459 | 131.3% | Sep 19 |
| 1880 Steiner St #401 | 2 | 2 | 1,569 | $1,675,000 | $1,068 | 112.6% | Sep 24 |
| 3033 Octavia St | 3 | 2 | 1,220 | $1,650,000 | $1,352 | 113.8% | Sep 30 |
| 201 Folsom St #4F | 2 | 2 | 1,191 | $1,650,000 | $1,385 | 100.0% | Sep 30 |
| 708 Long Bridge St #908 | 2 | 2 | 1,237 | $1,650,000 | $1,334 | 100.1% | Sep 26 |
| 650 2nd St #404 | 1 | 2 | 1,794 | $1,625,000 | $906 | 95.9% | Sep 22 |
| 35 Rosemont Pl | 2 | 2 | 1,390 | $1,600,000 | $1,151 | 146.1% | Sep 21 |
| 301 Main St #10F | 2 | 2 | 1,307 | $1,550,000 | $1,186 | 100.1% | Sep 29 |
| 1275 Indiana St #106 | 2 | 2 | 1,203 | $1,550,000 | $1,288 | 114.9% | Sep 18 |
| 1902 Filbert St | 1 | 2 | 945 | $1,500,000 | $1,587 | 146.3% | Sep 19 |
| 1025 Lombard St #4 | 1 | 1 | 950 | $1,401,000 | $1,475 | 140.4% | Sep 23 |
| 555 Fulton St #211 | 2 | 2 | 1,161 | $1,400,000 | $1,206 | 107.8% | Sep 17 |
| 2415 Buchanan St #3 | 1 | 2 | 1,045 | $1,325,000 | $1,268 | 103.1% | Sep 22 |
| 101 Lombard St #201E | 2 | 2 | 1,238 | $1,300,000 | $1,050 | 108.3% | Sep 22 |
| 582 Douglass St | 1 | 1 | 1,033 | $1,300,000 | $1,258 | 130.7% | Sep 18 |
| 1252 Washington St | 2 | 2 | 1,280 | $1,250,000 | $977 | 100.0% | Sep 29 |
| 333 Beale St #7D | 1 | 2 | 1,033 | $1,210,000 | $1,171 | 101.3% | Sep 29 |
| 401 Harrison St #37G | 1 | 1 | 758 | $1,115,000 | $1,471 | 99.1% | Sep 28 |
| 555 4th St #731 | 2 | 2 | 1,150 | $1,100,000 | $957 | 122.4% | Sep 29 |
| 60 Rausch St #205 | 2 | 2 | 1,437 | $1,050,000 | $731 | 107.3% | Sep 22 |
| 631 Folsom St #15E | 2 | 2 | 906 | $900,000 | $993 | 94.7% | Sep 18 |
| 325 Berry St #306 | 1 | 1 | 882 | $880,000 | $998 | 98.3% | Sep 18 |
| 2075 Sutter St #319 | 1 | 1 | 720 | $805,000 | $1,118 | 115.2% | Sep 25 |
| 701 Minna St #6 | 1 | 2 | 1,173 | $775,000 | $661 | 111.5% | Sep 21 |
| 1818 Broadway St #201 | 1 | 1 | 625 | $770,000 | $1,232 | 98.8% | Sep 24 |
| 271 Shipley St #3 | 2 | 1 | — | $752,000 | — | 108.2% | Sep 26 |
| 300 3rd St #922 | 1 | 1 | 807 | $720,000 | $892 | 103.2% | Sep 27 |
| 1080 Sutter St #703 | 2 | 1 | 750 | $665,000 | $887 | 111.0% | Sep 19 |
| 400 Beale St #1702 | 1 | 1 | 675 | $650,000 | $963 | 94.2% | Sep 22 |
| 301 Mission St #12D | 1 | 1 | 751 | $585,000 | $779 | 93.6% | Sep 17 |
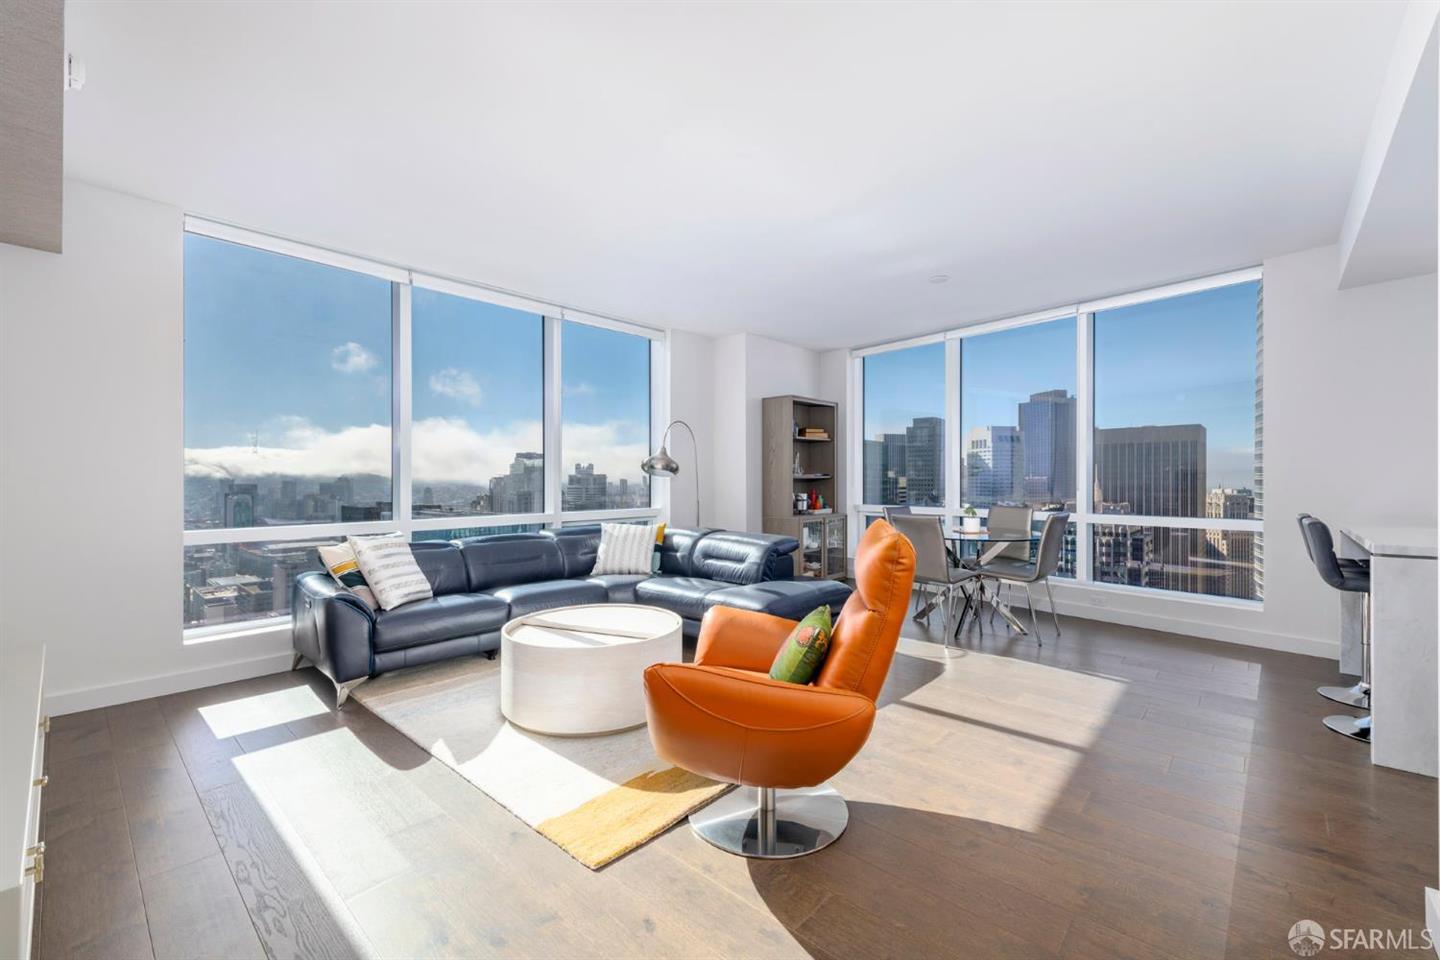
Four transactions merit closer reading. 2254 Bush Street, a 2002-built, 1,785-square-foot three-bed on the western edge of Pacific Heights, listed at $2,185,000 and closed at $3,000,000 — a 37.3-percent premium. 35 Rosemont Place, a 1,390-square-foot two-bed listed at $1,095,000, closed at $1,600,000, the largest percentage gap over list in the entire month at 46.1 percent. 1902 Filbert Street, a one-bedroom at 945 square feet listed at $1,025,000, settled at $1,500,000 — 46.3 percent over ask, the single largest premium in raw percentage terms recorded this month. At the other end, 488 Folsom Street #4901, the month's highest-priced close at $4,922,000, came in 1.6 percent below its $4,999,999 ask — one of only nine transactions in the entire month to close under list price.
Where the market split
By segment
The source records one segment for September.
| Segment | Closings | Median Price | Median $/SF | Median Size | Over List |
|---|---|---|---|---|---|
| Condominium | 43 | $1,550,000 | $1,205 | 1,212 sq ft | 31 (72%) |
By price band
With the full 43-closing sample spread across five bands, the per-square-foot progression from bottom to top is steady but not uniform. The $2M–$3M band produced a median of $1,488/SF across four sales — a notable step up from the $1.5M–$2M cohort, but still below the four sales above $3M that reached a median of $1,695/SF.
| Band | Closings | Median Sale Price | Median $/SF |
|---|---|---|---|
| Under $1M | 10 | $761,000 | $963 |
| $1M – $1.5M | 10 | $1,275,000 | $1,189 |
| $1.5M – $2M | 15 | $1,650,000 | $1,288 |
| $2M – $3M | 4 | $2,250,000 | $1,488 |
| $3M – $5M | 4 | $3,400,000 | $1,695 |
The $1.5M–$2M band was the most active, accounting for 15 of the 43 closings, and its median of $1,288/SF sits above both cheaper bands. The sub-$1M band returned a median of $963/SF across 10 sales — the only cohort where the majority of closings included some below-list results. Five of the nine total below-list sales came from units that closed under $1 million or just above it, which points to a specific softness at the lower end of the tower-inventory stack rather than a market-wide condition.
The four sales above $3 million ranged from $3.3 million (2211 Scott Street) to $4.922 million (488 Folsom #4901), with a median of $3,400,000. With only four data points, no reliable trend can be drawn from this cohort, but the range and per-square-foot figures ($1,547–$2,280/SF) reflect both location and building vintage differences rather than a single directional signal.
Against asking
Of the 43 closings, 31 finished above list price, 3 at list, and 9 below. The median sale-to-list ratio across all 43 was 107.8 percent. The largest recorded premium was 46.3 percent (1902 Filbert Street); the largest discount was 7.1 percent. The over-ask pattern was not distributed randomly: units with Cow Hollow, Lower Pacific Heights, and Hayes Valley addresses accounted for a disproportionate share of the largest premiums, while several South Beach and Rincon Hill tower units — where the product is more uniform and alternatives more plentiful — settled at or below their ask.
Across the period
The source provides a single month of trend data. A multi-month comparison table cannot be constructed from the available record.
| Month | Closings | Median Sale Price | Median $/SF |
|---|---|---|---|
| September 2026 | 43 | $1,550,000 | $1,205 |
With one data point, no direction of travel can be stated. The six-month trend field in the source contains only September, and the year-ago field carries no confirmed closings for September 2025, so neither a sequential nor an annual comparison is available from this record.
What it means
For sellers. September's 43 closings show that 72 percent of listed condominiums found a buyer above asking price, with a median ratio of 107.8 percent across the full sample. That outcome was not uniform: smaller units in established residential neighborhoods — Cow Hollow, Lower Pacific Heights, Hayes Valley, Noe Valley — produced the largest premiums, while larger-format tower units in South Beach and Rincon Hill closed closer to, at, or below their list prices. The 261 active listings currently in inventory, at a median active price of $1,195,000, will be entering a market where September's median closing price was $1,550,000 — a gap that reflects the mix of what actually sold rather than a guaranteed outcome for any individual property.
For buyers. Nine of the 43 September closings settled below list price, all of them in the tower-heavy corridors along the Embarcadero and South of Market. The sub-$1M band, with 10 closings and a median of $761,000, produced the highest concentration of at-or-below-ask results. Units in low-rise buildings in walkable residential neighborhoods accounted for most of the significant over-ask outcomes, several of which cleared their list prices by more than 30 percent. The 101 pending sales currently in the pipeline suggest continued activity, though the closing record alone does not indicate the pace at which active listings are converting.
For owners not transacting. The month's $69.5 million in total condominium volume across 43 closings, at a median price of $1,550,000 and a median of $1,205 per square foot, is one month's data with no confirmed prior-year comparison available. The per-square-foot range across the 43 sales ran from $661 (701 Minna Street) to $2,280 (488 Folsom #4901) — a spread that reflects size, location, building type, and vintage differences across a single asset class rather than a single readable signal about the condominium market as a whole.
Tim McMullen · CA DRE #02016832
[email protected] · (415) 691-9272
Tim McMullen, CA DRE #02016832. Real estate services provided by Tim McMullen, Broker, CA DRE #02016832. Figures are from recorded sales; nothing here is an opinion of the value of any home.