Condo Market SF › Market reports
Museum Parc sold ten condos this year, up from six, and eight of them were one-bedrooms under $820,000
Every 2026 closing at Museum Parc, a 1990 building across from the Moscone Center, against the record since 1997
Ten closings at 300 3rd Street through October 15, against six in the 2025 window. Median price per square foot rose from $741 to $832; the building's 2015 high was $1,055. Median days on market fell from 50 to 21. Harvey AI's 150,000 square feet is across the street at 201 Third.
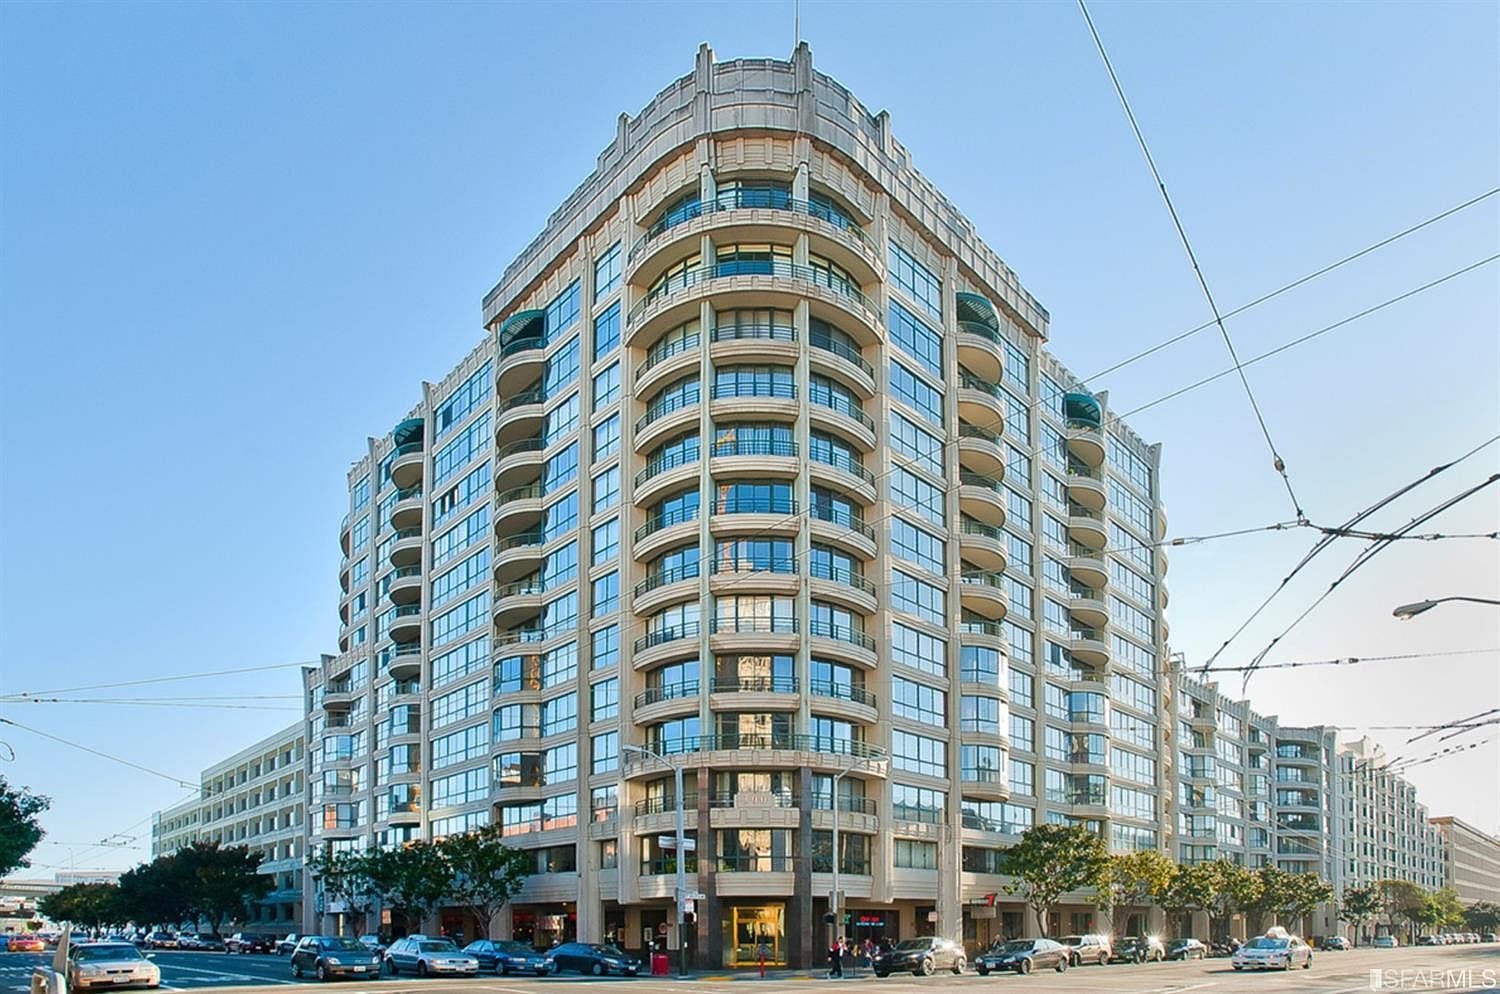
Museum Parc is the oldest building in this series and the cheapest per foot, and 2026 is its busiest year since 2021. Ten condominiums closed at 300 3rd Street between January 1 and October 15, against six in the same window of 2025 and seven for all of last year; $7.9 million of volume against $4.9 million.
Eight of the ten were one-bedrooms, which is why the median sale price, $732,500, is lower than last year's $820,000 while the per-foot figure went the other way: $832 a square foot against $741, up 12 percent. One-bedrooms held at $854 a foot against $855; the two two-bedrooms sold at $783 against $674. The building's best year on a per-foot basis was 2015 at $1,055, and it has sat under $900 since 2021, so this year recovers a share of a long slide rather than the slide.
The listings moved faster. Median days on market is 21 against 50, and the two highest sales — #506, a 1,472-square-foot two-bedroom at $1,100,000, and #305 at $951,000 — went into contract in two and five days. #1411, by contrast, sat 136 days before closing at $816,000.
Two paired resales are on record, both up: #922, bought in August 2006 for $645,000 and sold in September for $720,000, and #305, bought in May 2023 for $800,000 and sold for $951,000, up 18.9 percent in three years. The low sale was #1208, an 807-square-foot one-bedroom, at $650,000.
2026 so far, against the same window in 2025
Closings at Museum Parc between January 1 and October 15, 2026, set against January 1 to October 15, 2025. Days on market is median days from listing to contract on MLS-listed sales; "under 15 days" counts how many of those went into contract inside two weeks.
| Measure | 2025 (same window) | 2026 year to date |
|---|---|---|
| Closings | 6 | 10 |
| Dollar volume | $4,920,000 | $7,877,000 |
| Median sale price | $820,000 | $732,500 |
| Median $/sq ft | $741 | $832 |
| Median days on market | 50 | 21 |
| Under 15 days (of MLS sales) | 0 of 6 | 2 of 9 |
Year by year
Every recorded closing at Museum Parc since September 1997, by calendar year. 2026 runs through October 15, 2026. Days on market is available for MLS-listed sales from 2020 onward.
| Year | Closings | Median price | Median $/sq ft | Median days | High sale |
|---|---|---|---|---|---|
| 2016 | 5 | $700,000 | $929 | — | $1,289,000 |
| 2017 | 8 | $770,000 | $993 | — | $1,325,000 |
| 2018 | 6 | $1,090,000 | $1,050 | — | $1,400,000 |
| 2019 | 10 | $974,500 | $1,048 | — | $1,275,000 |
| 2021 | 11 | $969,000 | $888 | 36 | $1,170,000 |
| 2022 | 6 | $836,750 | $835 | 53 | $1,450,000 |
| 2023 | 4 | $865,000 | $791 | 40 | $1,153,000 |
| 2024 | 6 | $751,000 | $794 | 24 | $1,010,000 |
| 2025 | 7 | $815,000 | $778 | 44 | $1,020,000 |
| 2026 | 10 | $732,500 | $832 | 21 | $1,100,000 |
The building's highest median price per square foot in any year with five or more closings was $1,055 in 2015 (5 closings). 2026 year to date stands at $832.
By bedroom count, 2025 against 2026
| Beds | 2025 closings | 2025 median | 2025 $/sq ft | 2026 closings | 2026 median | 2026 $/sq ft |
|---|---|---|---|---|---|---|
| 1 bed | 4 | $732,500 | $855 | 8 | $722,500 | $854 |
| 2 bed | 3 | $860,000 | $674 | 2 | $1,025,500 | $783 |
Every closing in 2026
All 10 closings through October 15, 2026, highest price first. Square footage and days on market are as recorded on the MLS; county-recorded transfers that never listed show no days.
| Unit | Bd | Sq ft | Sold | $/sq ft | Days | Closed |
|---|---|---|---|---|---|---|
| 300 3rd Street, #506 | 2 | 1,472 | $1,100,000 | $747 | 2 | Aug 15 |
| 300 3rd Street, #305 | 2 | 1,161 | $951,000 | $819 | 5 | Aug 18 |
| 300 3rd Street, #1411 | 1 | 946 | $816,000 | $863 | 136 | Aug 14 |
| 300 3rd Street, #1211 | 1 | 946 | $775,000 | $819 | 19 | Oct 07 |
| 300 3rd St #907 | 1 | 946 | $740,000 | $782 | — | Mar 27 |
| 300 3rd Street, #321 | 1 | 859 | $725,000 | $844 | 56 | Jul 24 |
| 300 3rd Street #922 | 1 | 807 | $720,000 | $892 | 21 | Sep 26 |
| 300 3rd Street #724 | 1 | 807 | $700,000 | $867 | 19 | Sep 01 |
| 300 3rd Street, #915 | 1 | 807 | $700,000 | $867 | 102 | Oct 13 |
| 300 3rd Street, #1208 | 1 | 807 | $650,000 | $805 | 34 | Jul 10 |
Paired resales
Units that closed in 2026 and had a prior recorded sale in the same building. The change is gross, before any improvements, fees or carrying costs.
| Unit | Prior sale | Prior price | 2026 sale | 2026 price | Change |
|---|---|---|---|---|---|
| 300 3rd Street #922 | Aug 2006 | $645,000 | Sep 2026 | $720,000 | +11.6% |
| 300 3rd Street, #305 | May 2023 | $800,000 | Aug 2026 | $951,000 | +18.9% |
2 of these resold above the prior price, 0 below.
Third Street, across from Moscone
Museum Parc fronts Third Street between Folsom and Howard, across from the Moscone Center and a block from SFMOMA. Harvey AI's 150,000 square feet at 201 Third Street is directly across the street, and Anthropic's Howard Street cluster — 300, 342, 400, 405 and 500 Howard — begins two blocks east (SF Standard; The Real Deal). CBRE recorded SoMa asking rents at $82.57 a foot in Q3 2026, up 31.7 percent in a year, with the submarket leading the city's vacancy decline (SF Examiner).
The timetable that every South of Market building now sits inside is the public-offering calendar. Anthropic filed a confidential draft registration with the SEC on June 1, 2026, a week after a funding round that set its valuation at $965 billion (TechCrunch). As of this week the Standard reports the Anthropic listing has been pushed to November, after the midterms, that OpenAI's has moved to 2027, and that Anthropic is weighing a lockup longer than the usual six months (SF Standard). The same piece carries a Redfin estimate that current and former OpenAI and Anthropic employees could in theory buy close to a third of the metro area's homes with their proceeds, and the counter-argument from UC Berkeley's Enrico Moretti and the Bay Area Council's Jeff Bellisario that the money is concentrated in fewer hands than past booms and that these firms create fewer jobs per dollar because so much goes to data centers rather than headcount. The record in this report ends on October 15. None of it reflects a single share that has been sold.
Two citywide facts frame every building figure here. First, the office recovery is lopsided: CBRE put Q3 2026 vacancy at 27.7 percent citywide, down 6.6 points in a year, but Avison Young splits that into roughly 12 percent for Class A and north of 31 percent for Class B, and a Presidio Bay executive told Bisnow the headline number is misleading for that reason (Bisnow). Second, the condo market is still digging out: the Chronicle's May analysis found that only eight Bay Area ZIP codes showed inflation-adjusted condo gains over the year, all of them in San Francisco, and that Noe Valley's typical condo remained close to $400,000 below its 2019 level in real terms (SF Chronicle).
How this was counted
Two records feed this review. The MLS layer is one row per listing and carries days on market and square footage. The county layer reaches back further and catches transfers that never listed, but records the same closing once per data source, so the two were merged on unit, date and price and each closing kept once. Below-market-rate units and transfers under $300,000 are listed but excluded from every median. "Same window" means January 1 to October 15 of each year. Nothing here is a valuation of any unit, and nothing here is advice.
Tim McMullen · CA DRE #02016832
[email protected] · (415) 691-9272
- https://sfstandard.com/2026/04/07/i-leaderboard-san-francisco-office/
- https://therealdeal.com/san-francisco/2026/04/07/anthropic-signs-another-san-francisco-office-lease/
- https://www.sfexaminer.com/news/the-city/sfs-high-office-vacancy-rate-drops-again-as-ai-fueled-recovery-shows-legs/article_14d60cc1-a6dc-4228-9a44-b5b8c4d36b8c.html
- https://techcrunch.com/2026/06/01/anthropic-files-to-go-public/
- https://sfstandard.com/pacific-standard-time/2026/10/14/pst-anthropic-openai-ipos-sf-wealth/
- https://www.bisnow.com/news/san-francisco/office/ai-surge-driving-sf-office-market-leasing-to-strong-totals-in-decades
- https://finance.yahoo.com/markets/stocks/articles/bay-area-condo-values-still-120000717.html
- Museum Parc · 300 3rd St · Yerba Buena
Tim McMullen, CA DRE #02016832. Real estate services provided by Tim McMullen, Broker, CA DRE #02016832. Figures are from recorded sales; nothing here is an opinion of the value of any home.