Your 94105 Tower Unit and That $800 Price Gap: What the Data Can't Tell You
The 94105 zip code is almost entirely condos built after 2000, many of them in mid- and high-rise buildings. Recorded sales show a wide price-per-square-foot spread — but attributing that spread to any single feature requires more caution than the data alone allows.
A market built vertically
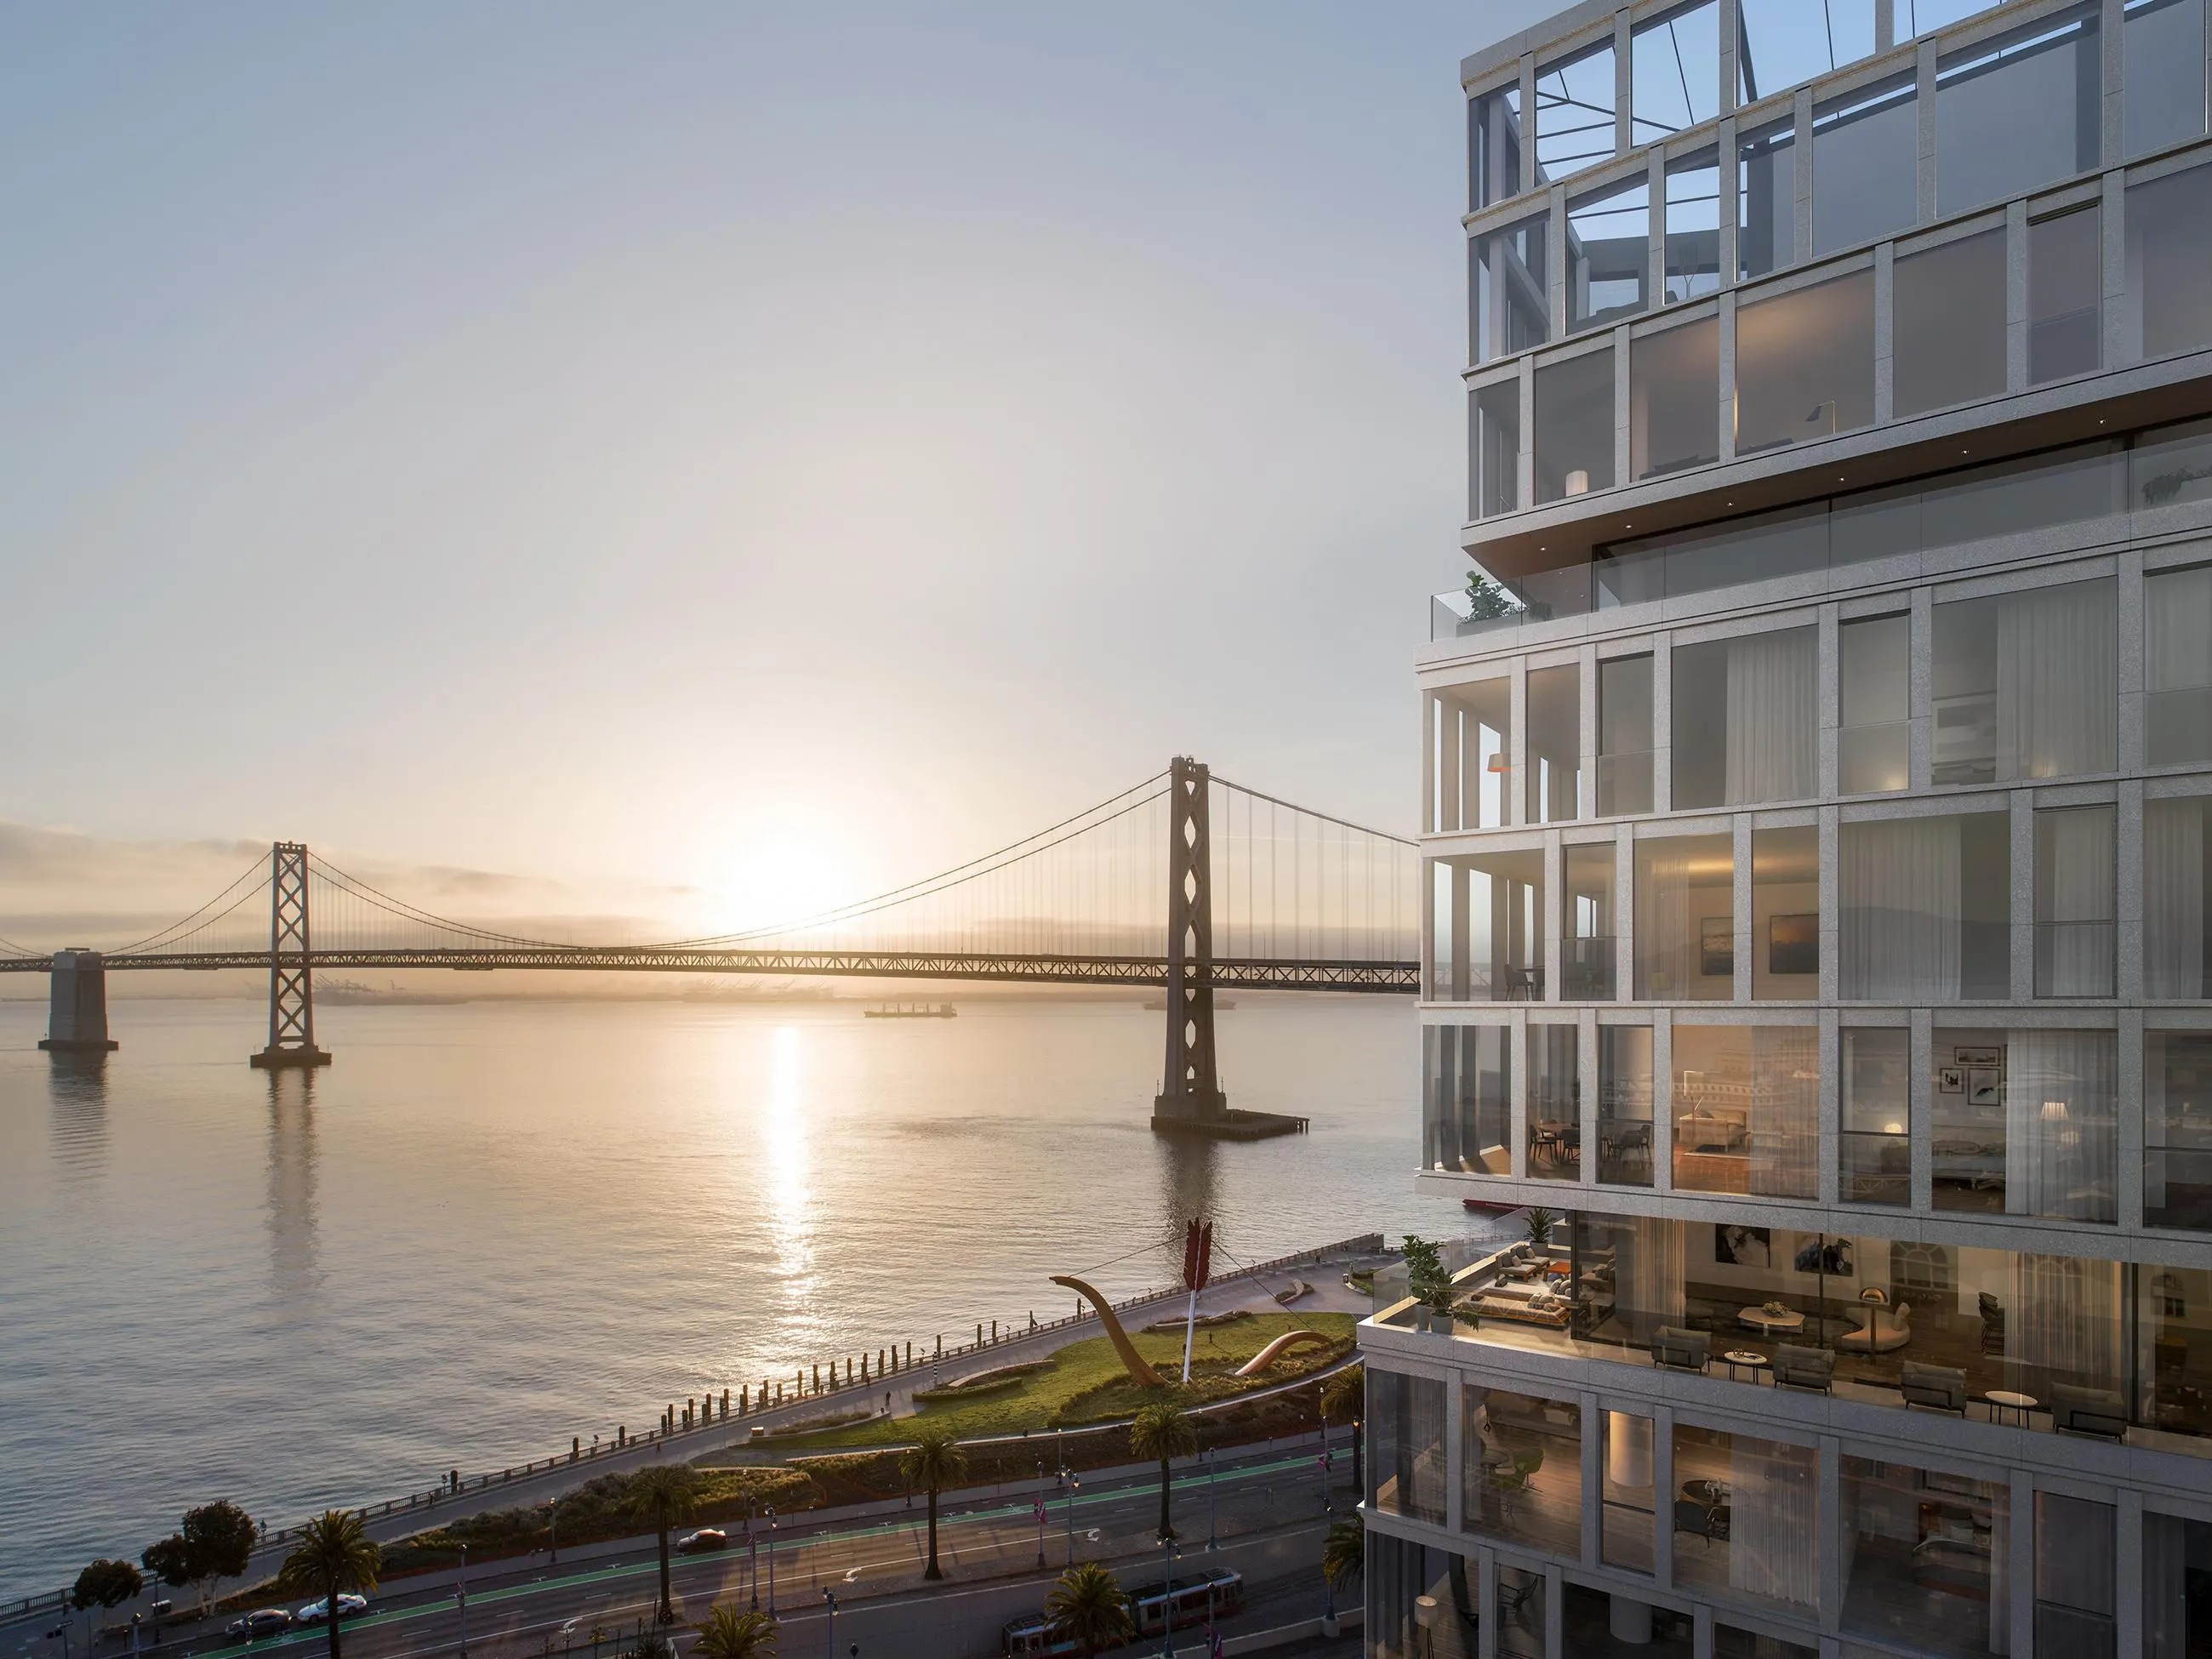
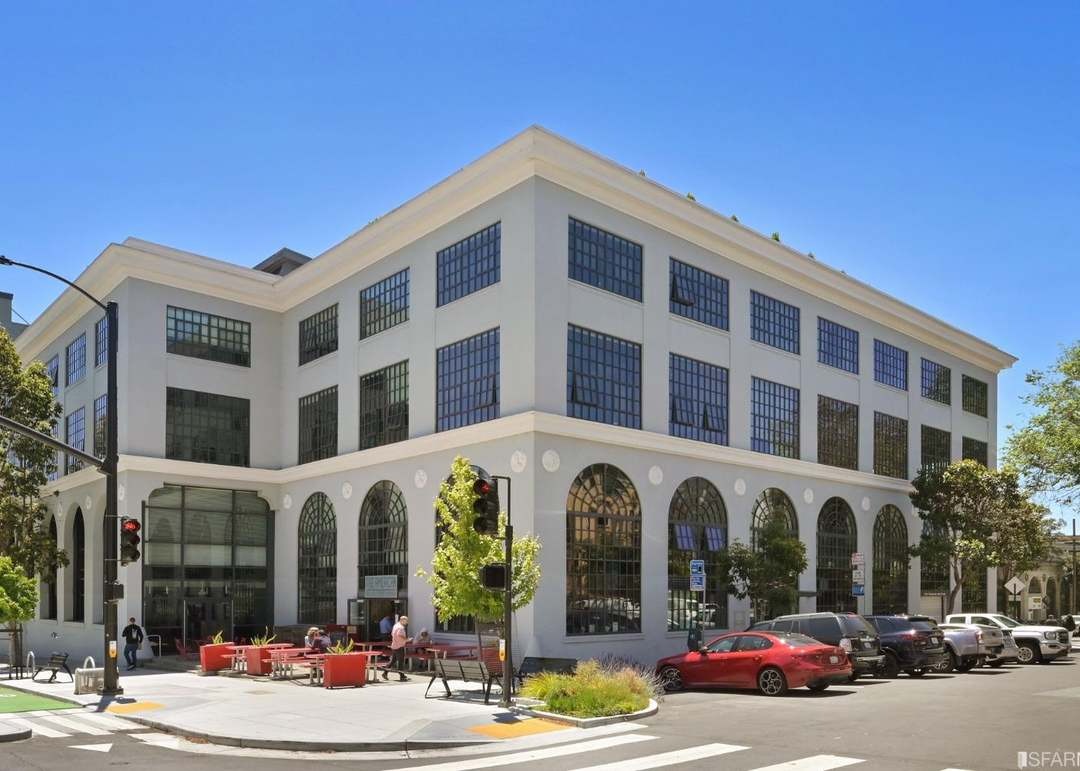
Of the 10,192 condos on record in this market, the vast majority — roughly 8,330 — were built in 2000 or later, and the median year built is 2008. That is not a coincidence: the 94105 zip code covers Rincon Hill, the South Beach waterfront corridor, and parts of SoMa, all of which saw the bulk of San Francisco's high-rise condo construction in the 2000s and 2010s. When a market is this skewed toward newer towers, floor and unit position are built into the product from the start, and buyers and sellers both know it.
The relevant question for an owner is simpler and more honest than "what is my view worth": it is what the sales record actually shows, and what it cannot tell you.
San Francisco's condominiums, from the record
| Built | Units |
|---|---|
| before 1940 | 452 |
| 1940-1959 | 56 |
| 1960-1979 | 823 |
| 1980-1999 | 342 |
| 2000 or later | 8,330 |
10,003 of 10,207 parcels in this market's record have a known build year.
What the price spread looks like
Across 273 recorded sales in the trailing 12 months, the median sale price was $1,330,000, with a median of $1,196 per square foot. The spread around that median is wide: the 10th-percentile unit sold at $899 per square foot, the 90th at $1,710 — a range of more than $800 per square foot across the same market, same period. The trailing 24-month window, covering 654 sales, shows a similar story: $829 at the 10th percentile, $1,632 at the 90th, with a median of $1,141 per square foot.
That $800-plus gap is real. It is also doing a lot of work. Floor level, unit orientation, exposure (north, south, east, west), interior finish level, square footage efficiency, parking, storage, and building amenities all feed into where a specific sale lands within that range. The recorded data does not separate those variables, and no honest reading of it should pretend otherwise.
Floor bands: what the record can and cannot show
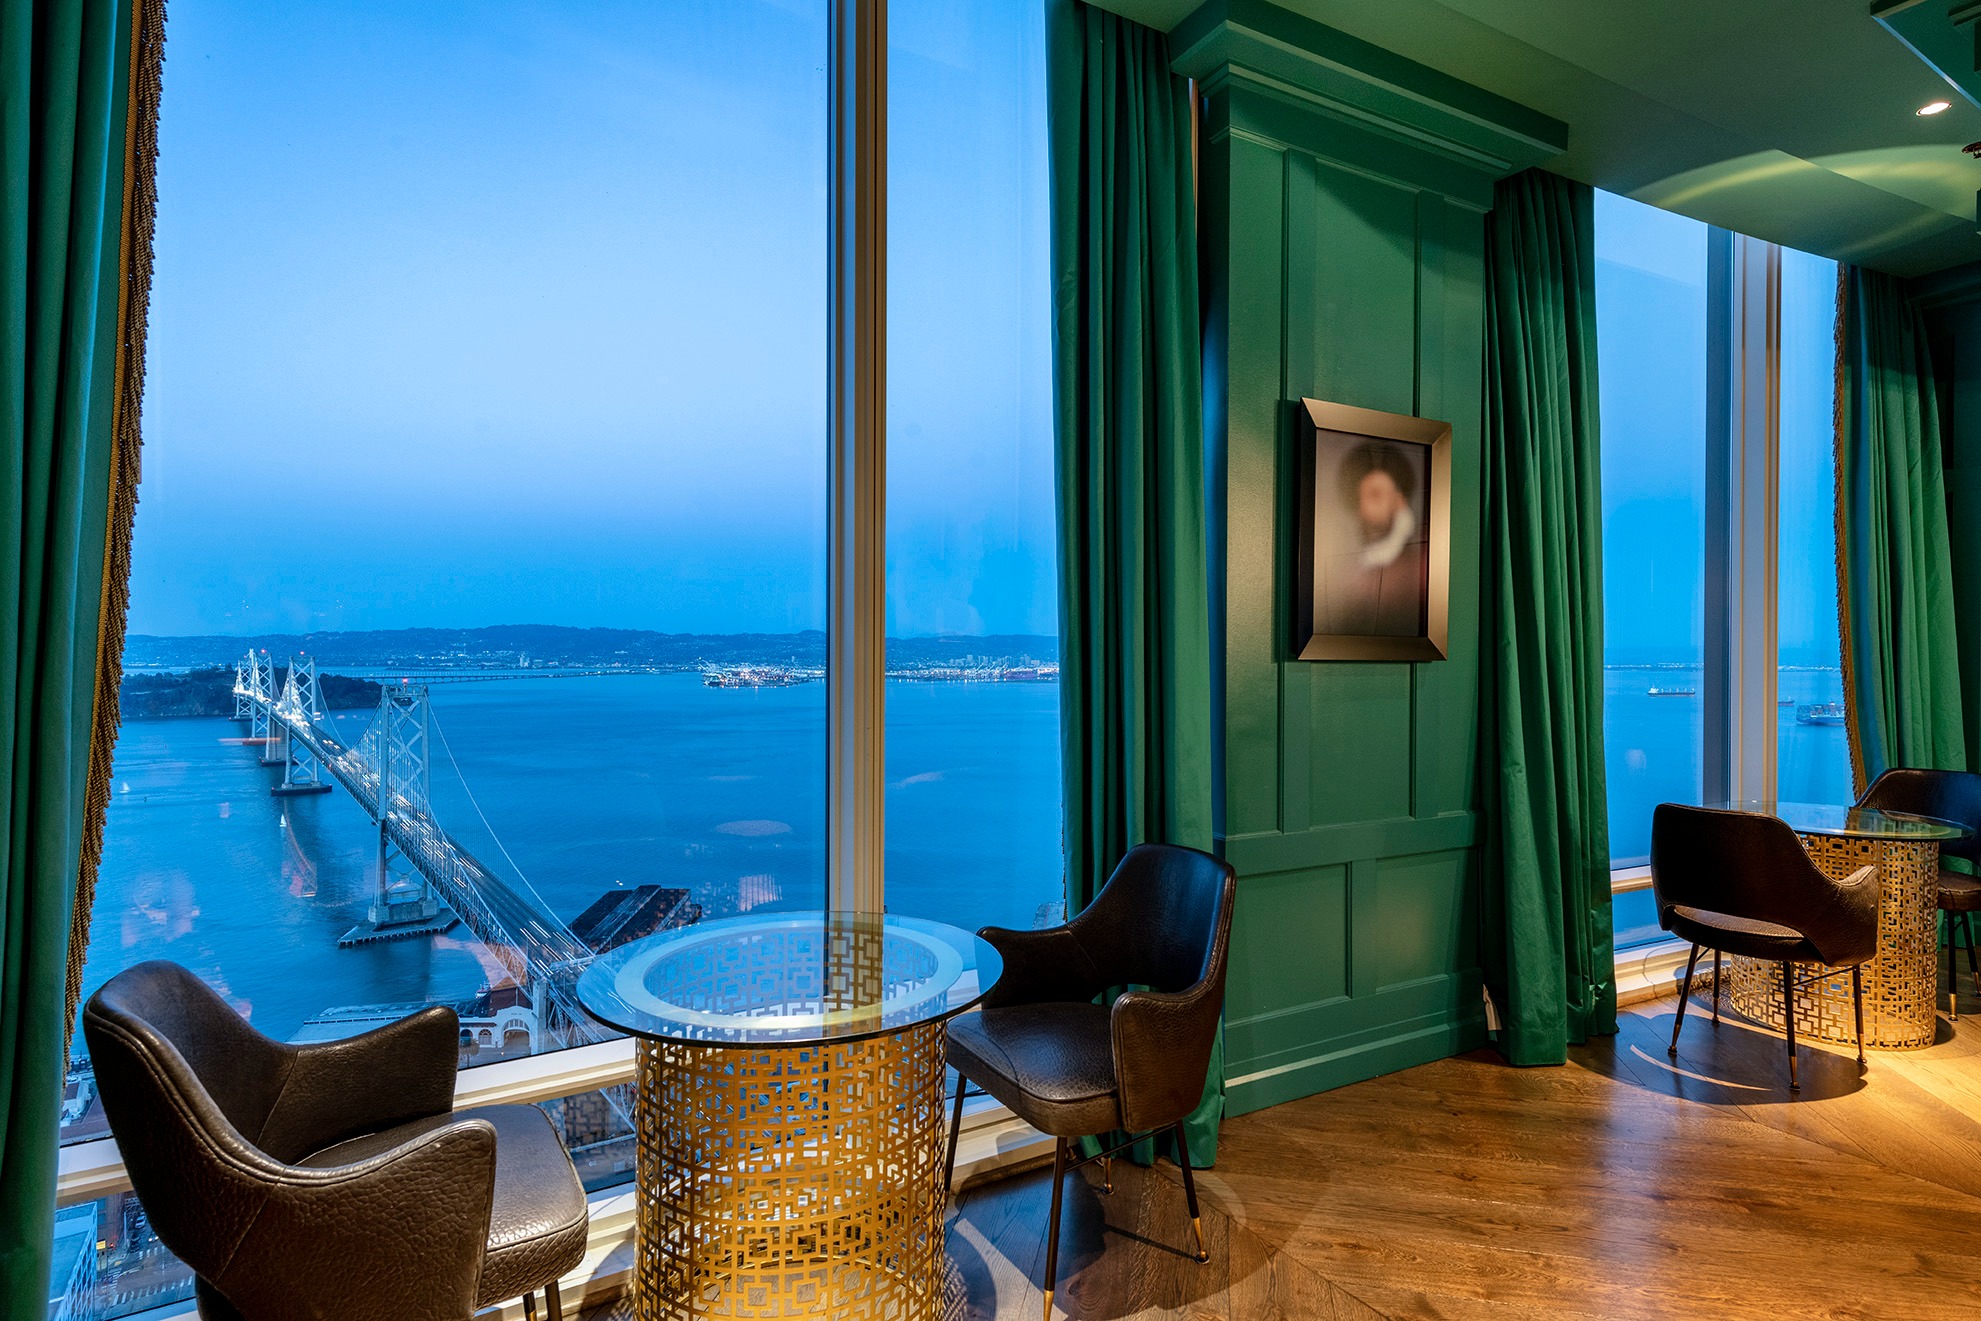
In a high-rise condo building, units are typically grouped by floor band in the way a building is marketed and in the way associations sometimes structure their CC&Rs — podium levels, mid-rise floors, upper floors, and penthouses or top-floor units. Those distinctions matter to owners because they often correspond to differences in exposure, noise profile, and what you see from your windows on any given morning.
The sales record for 94105 does not tag individual transactions by floor band in a way that allows a clean, statistically reliable breakdown here. Assessor records carry unit addresses, not floor numbers as a structured field, and the sample — 273 sales in the last 12 months across a zip code with over 10,000 condo parcels — is not large enough to slice meaningfully by floor tier without producing groups too thin to report with any confidence. Groups with fewer than five sales in a given band are not reported at all, which is the right call: thin slices produce noise, not insight.
What the record does show is that the market's overall price-per-square-foot distribution is skewed toward the upper end: a median of $1,196 with a 90th percentile of $1,710 suggests a meaningful cluster of high-end sales pulling the top of the range well above the midpoint. In a building stock dominated by newer mid- and high-rise towers, it is reasonable to observe that upper-floor and corner units in those buildings tend to be larger and more expensively finished — but that observation describes how those buildings were built and sold originally, not a floor-by-floor valuation formula.
Exposure and orientation in this geography
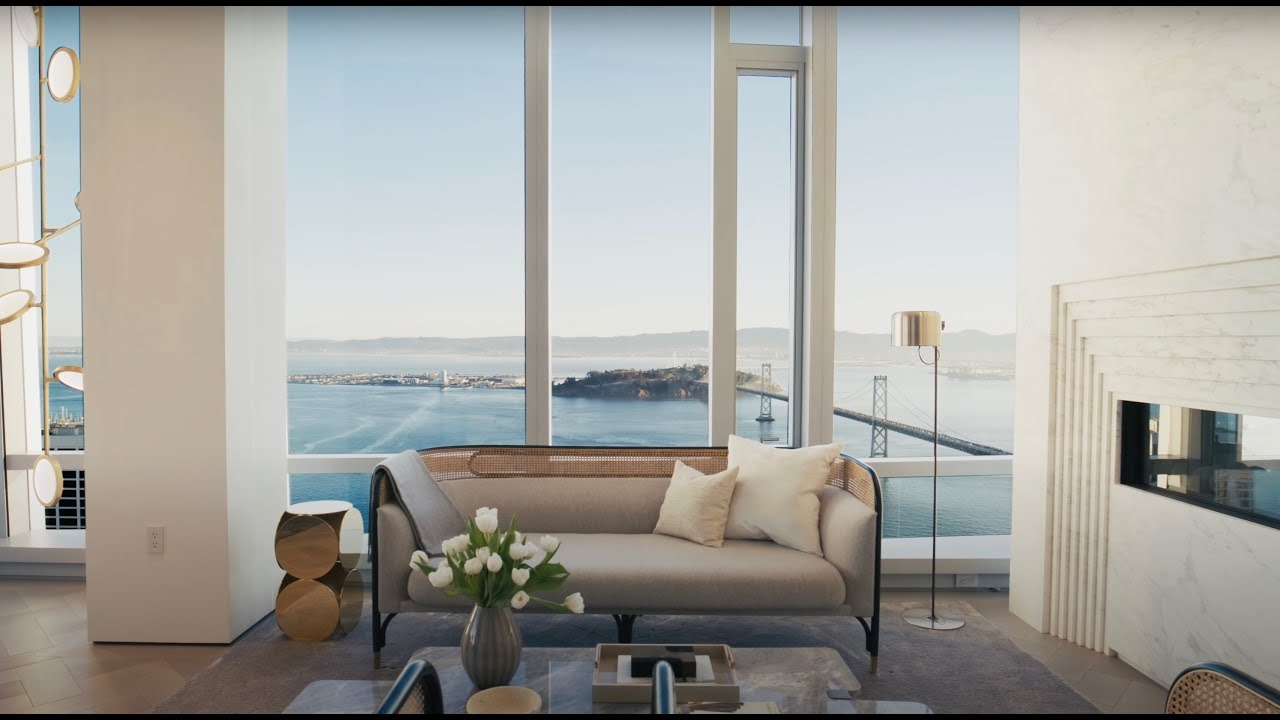
Unit orientation matters in 94105 in ways that are specific to this location. South and west exposures in the Rincon Hill and South Beach corridor can mean afternoon light and views toward the Bay Bridge or across to the East Bay hills. North-facing units in the same buildings may look toward the Financial District skyline or Treasure Island. East-facing units on lower floors can find their views compressed by neighboring towers, depending on when a given building was constructed relative to its neighbors.
Fog is also a genuine factor. San Francisco's marine layer moves through from the west and northwest in summer and fall. A unit with western exposure may trade afternoon sun for glare and fog earlier in the day in certain seasons; a southeastern exposure in the same building may see clearer skies more often during those months. None of this is a rule — microclimates in this city are genuinely micro — but it is the kind of thing worth walking through at different times of day before closing on a unit, not inferring from a sales table.
What an owner should take from this
If you own a unit in a 94105 tower and are trying to understand where your unit sits in the market, the price-per-square-foot range — $899 to $1,710 at the 10th and 90th percentiles over the last 12 months — tells you the market is not uniform. Where your unit lands in that range depends on a combination of factors that no single data field captures cleanly. A licensed appraiser working from comparable sales, with access to floor, exposure, and finish data on each comp, is the professional who actually does that work. The building record and the sales table are the starting point, not the answer.
Tim McMullen · CA DRE #02016832
[email protected] · (415) 691-9272
Tim McMullen, CA DRE #02016832. Real estate services provided by Tim McMullen, Broker, CA DRE #02016832. Figures are from recorded sales; nothing here is an opinion of the value of any home.