43 SF Condo Closings in September 2026: Median Holds at $1.55M as $4.9M Folsom Tower Sale Anchors a Wide Range
All 43 closings recorded in September 2026 were condominiums, spanning $585,000 to $4,922,000. The roster is dominated by units under $2M, but four sales above $3M pulled the per-square-foot curve sharply upward at the top end.
The period at a glance
The data source carries no list prices for this period, so no over-asking analysis appears below. Days on market were not recorded for any of the 43 closings, so no speed section is included.
| Metric | September 2026 |
|---|---|
| Total closings | 43 |
| Total volume | $69,525,000 |
| Median sale price | $1,550,000 |
| Median price per sq ft | $1,205 |
| Median square footage | 1,212 sq ft |
| Low sale | $585,000 |
| High sale | $4,922,000 |
| Segment | Condominium (all 43) |
Note: this is a small sample — 43 closings — and the figures below should be read accordingly. All 43 recorded sales were condominiums; no single-family or multi-unit transactions appear in the MLS data for the month.
The median sale price of $1,550,000 across 43 closings sits at a level that reflects the concentration of activity in the $1.5M–$2M band, which accounted for 15 of the 43 closings — more than any other band. The spread from $585,000 to $4,922,000 is wide enough that the median and the mean are telling different stories: total volume of $69,525,000 across 43 sales implies an average near $1,617,000, about $67,000 above the median, with the four sales above $3M doing most of the pulling.
The per-square-foot median of $1,205 across 43 sales has a natural ceiling and floor that the individual transactions make legible. At the top, 488 Folsom Street #4901 closed at $2,280/sq ft. At the bottom, 701 Minna Street #6 recorded $661/sq ft on a 1,173-square-foot one-bedroom — a gap of more than three-to-one within the same legal segment.
The sales
The table below shows the top 40 of 43 closings by sale price; the three lowest-priced sales of the month do not appear.
| Address | Beds | Sq Ft | Sale Price | $/Sq Ft | Closed |
|---|---|---|---|---|---|
| 488 Folsom St #4901 | 3 | 2,159 | $4,922,000 | $2,280 | Sep 26 |
| 756 Chestnut St | 3 | 2,262 | $3,500,000 | $1,547 | Sep 29 |
| 2211 Scott St | 3 | 1,930 | $3,300,000 | $1,710 | Sep 28 |
| 2254 Bush St | 3 | 1,785 | $3,000,000 | $1,681 | Sep 25 |
| 1998 Broadway St #405 | 3 | 1,390 | $2,450,000 | $1,763 | Sep 30 |
| 1035 Fell St | 4 | 2,054 | $2,300,000 | $1,120 | Sep 17 |
| 27 Ford St | 2 | 1,423 | $2,200,000 | $1,546 | Sep 23 |
| 1376 Florida St | 3 | 1,524 | $2,180,000 | $1,430 | Sep 25 |
| 401 Harrison St #26C | 2 | 1,334 | $1,995,000 | $1,496 | Sep 17 |
| 235 Berry St #115 | 3 | 1,910 | $1,975,000 | $1,034 | Sep 29 |
| 650 Delancey St #203 | 2 | 1,619 | $1,950,000 | $1,204 | Sep 17 |
| 616 Broderick St | 3 | 1,657 | $1,850,000 | $1,116 | Sep 29 |
| 758 Haight St #3 | 2 | 1,148 | $1,800,000 | $1,568 | Sep 30 |
| 1727 Grove St | 2 | 1,165 | $1,700,000 | $1,459 | Sep 19 |
| 1880 Steiner St #401 | 2 | 1,569 | $1,675,000 | $1,068 | Sep 24 |
| 3033 Octavia St | 3 | 1,220 | $1,650,000 | $1,352 | Sep 30 |
| 201 Folsom St #4F | 2 | 1,191 | $1,650,000 | $1,385 | Sep 30 |
| 708 Long Bridge St #908 | 2 | 1,237 | $1,650,000 | $1,334 | Sep 26 |
| 650 2nd St #404 | 1 | 1,794 | $1,625,000 | $906 | Sep 22 |
| 35 Rosemont Pl | 2 | 1,390 | $1,600,000 | $1,151 | Sep 21 |
| 301 Main St #10F | 2 | 1,307 | $1,550,000 | $1,186 | Sep 29 |
| 1275 Indiana St #106 | 2 | 1,203 | $1,550,000 | $1,288 | Sep 18 |
| 1902 Filbert St | 1 | 945 | $1,500,000 | $1,587 | Sep 19 |
| 1025 Lombard St #4 | 1 | 950 | $1,401,000 | $1,475 | Sep 23 |
| 555 Fulton St #211 | 2 | 1,161 | $1,400,000 | $1,206 | Sep 17 |
| 2415 Buchanan St #3 | 1 | 1,045 | $1,325,000 | $1,268 | Sep 22 |
| 101 Lombard St #201E | 2 | 1,238 | $1,300,000 | $1,050 | Sep 22 |
| 582 Douglass St | 1 | 1,033 | $1,300,000 | $1,258 | Sep 18 |
| 1252 Washington St | 2 | 1,280 | $1,250,000 | $977 | Sep 29 |
| 333 Beale St #7D | 1 | 1,033 | $1,210,000 | $1,171 | Sep 29 |
| 401 Harrison St #37G | 1 | 758 | $1,115,000 | $1,471 | Sep 28 |
| 555 4th St #731 | 2 | 1,150 | $1,100,000 | $957 | Sep 29 |
| 60 Rausch St #205 | 2 | 1,437 | $1,050,000 | $731 | Sep 22 |
| 631 Folsom St #15E | 2 | 906 | $900,000 | $993 | Sep 18 |
| 325 Berry St #306 | 1 | 882 | $880,000 | $998 | Sep 18 |
| 2075 Sutter St #319 | 1 | 720 | $805,000 | $1,118 | Sep 25 |
| 701 Minna St #6 | 1 | 1,173 | $775,000 | $661 | Sep 21 |
| 1818 Broadway St #201 | 1 | 625 | $770,000 | $1,232 | Sep 24 |
| 271 Shipley St #3 | 2 | — | $752,000 | — | Sep 26 |
| 300 3rd St #922 | 1 | 807 | $720,000 | $892 | Sep 27 |
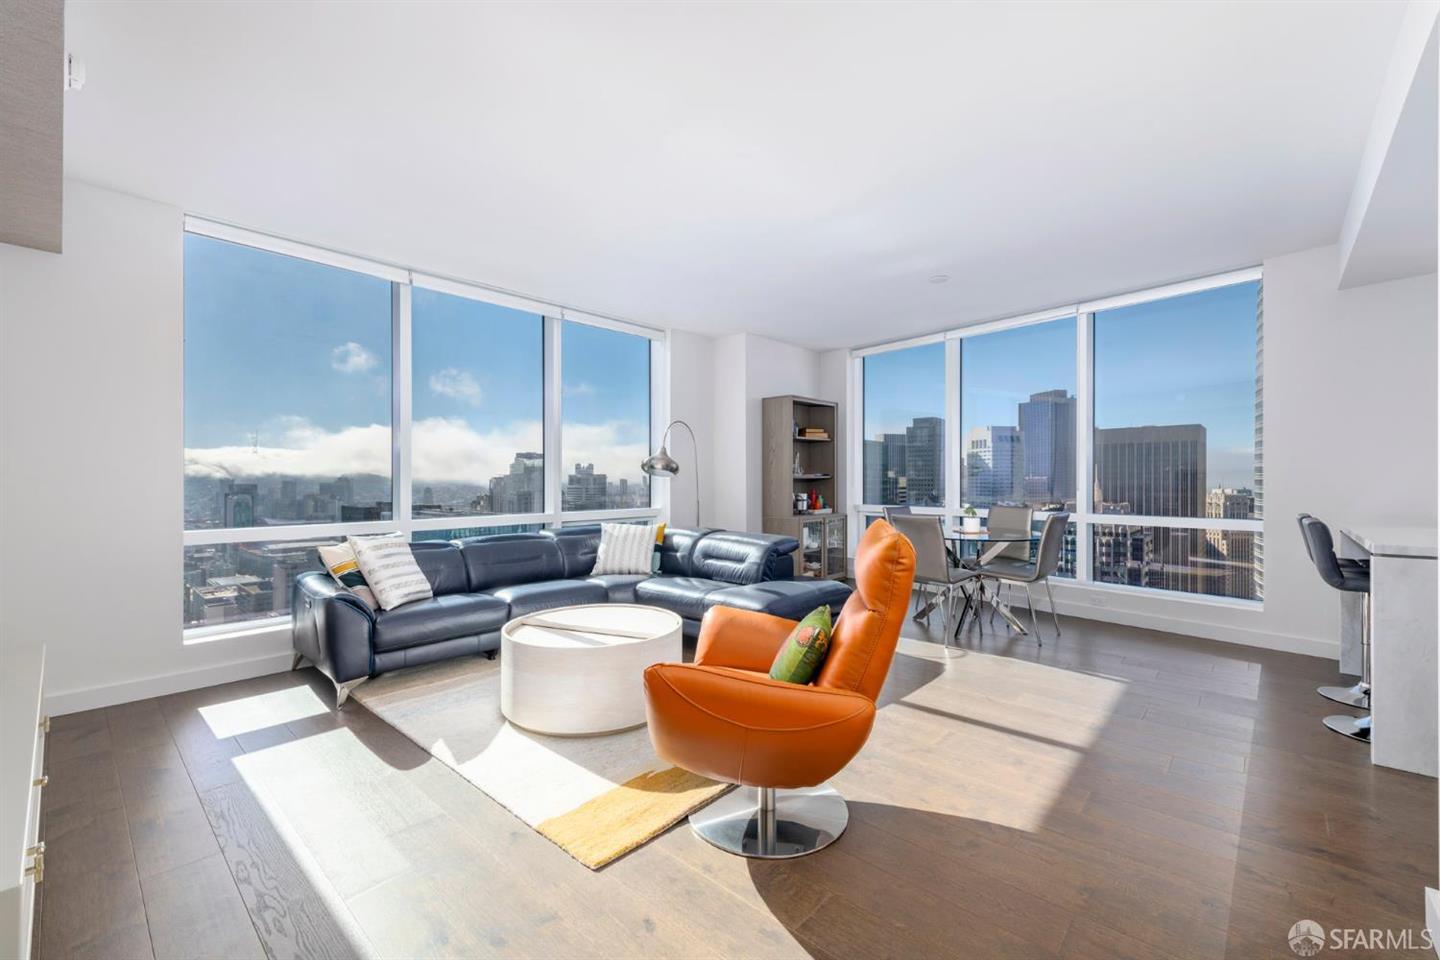
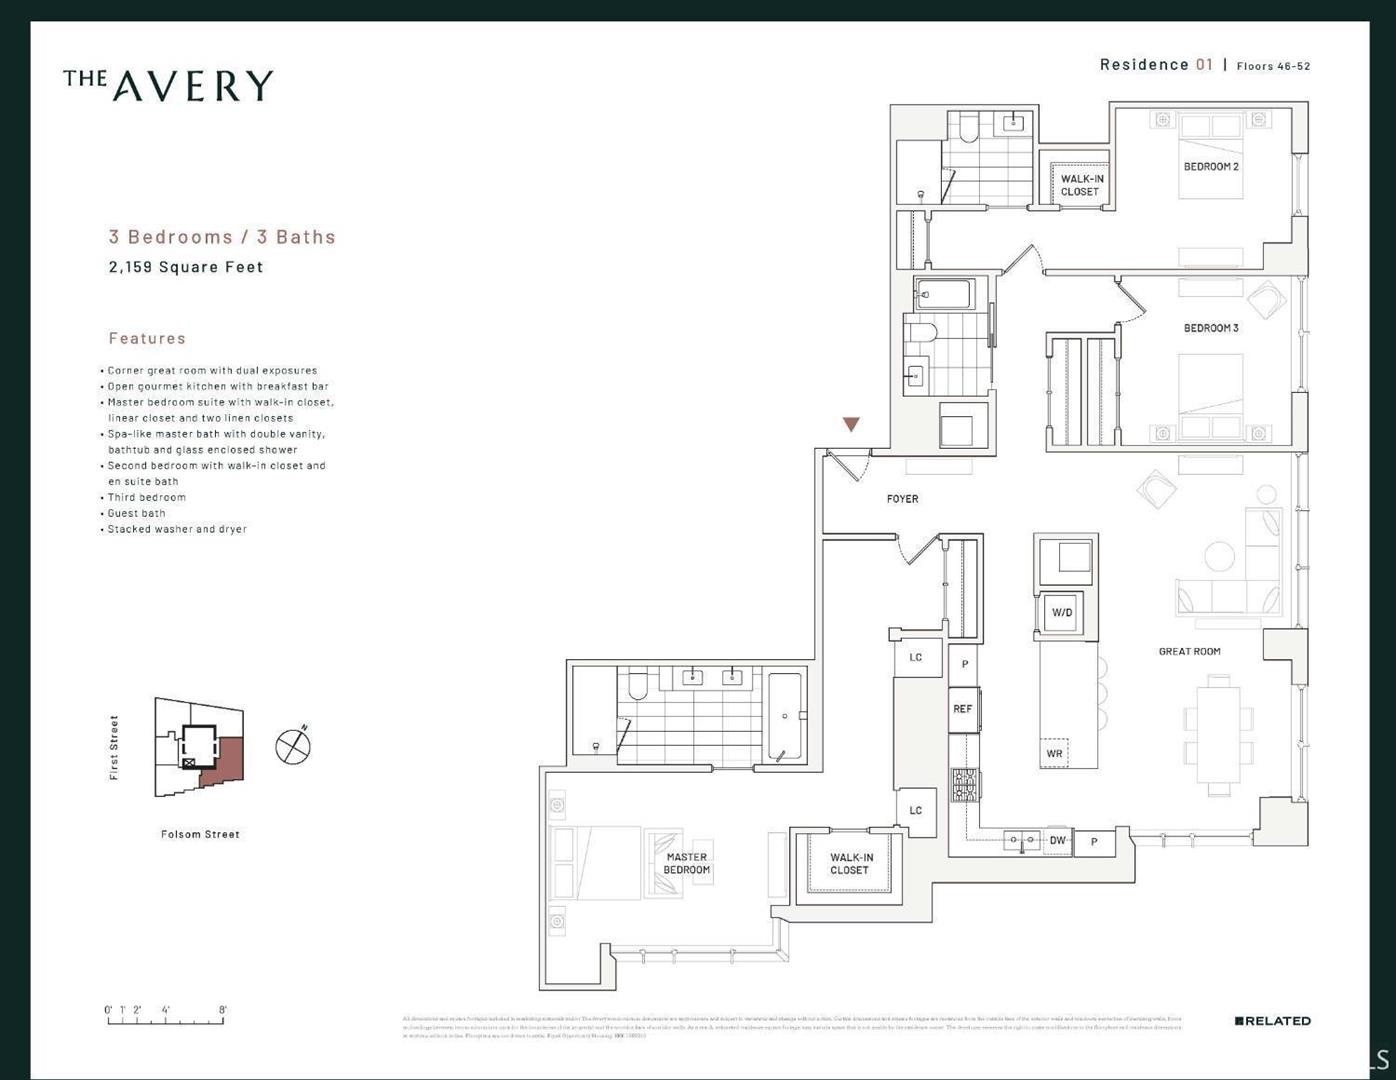
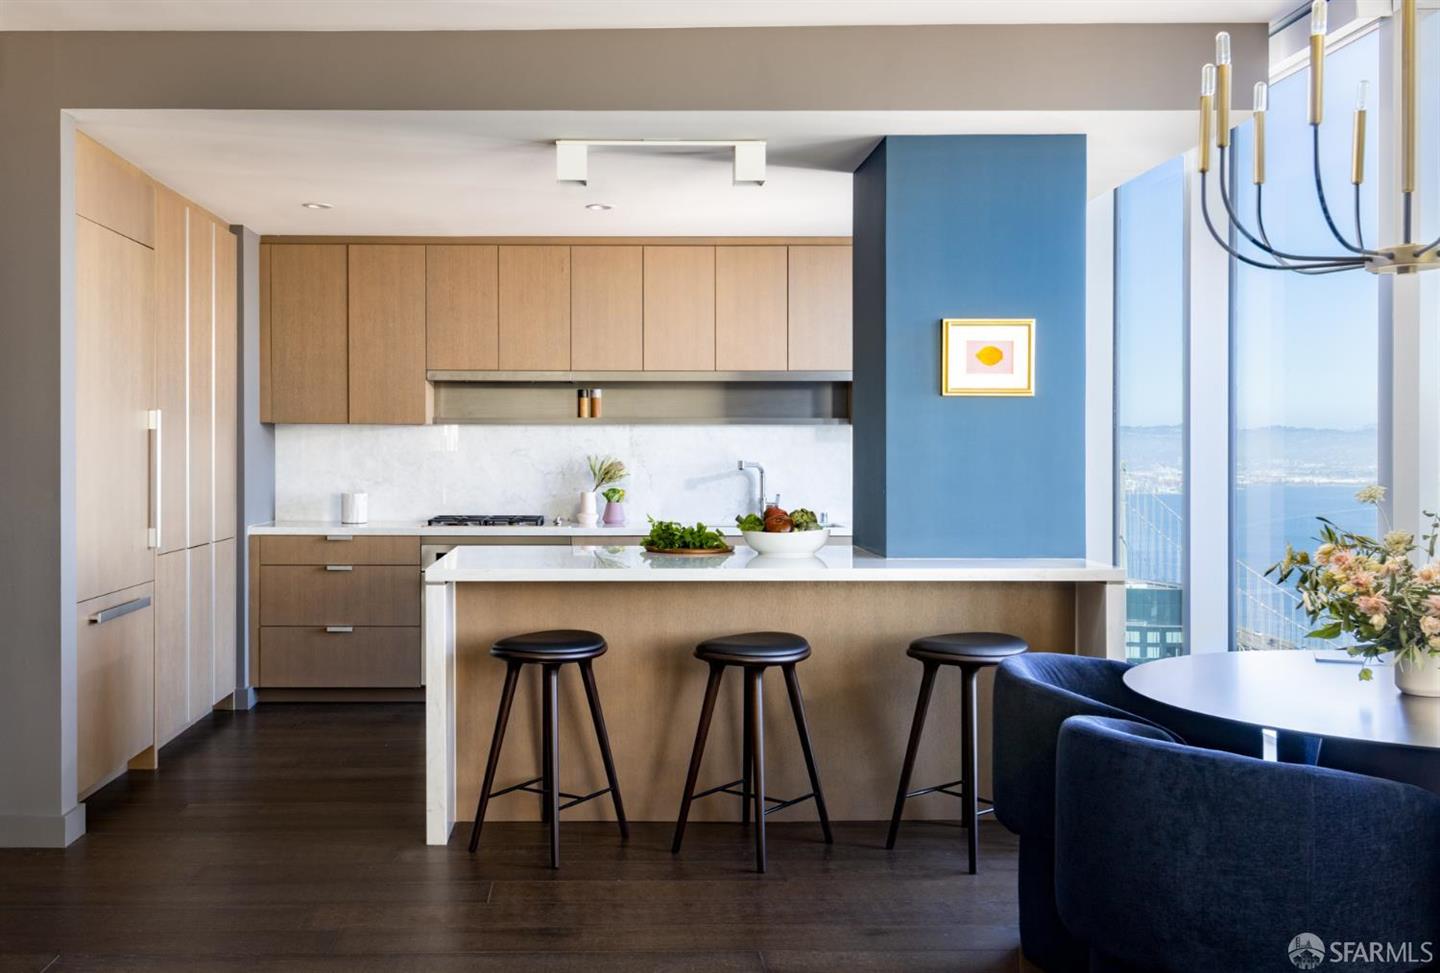
Four transactions anchor the month. At the top, 488 Folsom Street #4901 — a 2,159-square-foot, three-bedroom unit built in 2019 on the 49th floor — closed at $4,922,000, or $2,280 per square foot, nearly double the month's median rate. That single sale accounts for roughly 7 percent of total monthly volume.
The next three in line form their own cluster: 756 Chestnut Street at $3,500,000, 2211 Scott Street at $3,300,000, and 2254 Bush Street at $3,000,000 — all three-bedroom condominiums, all in the $1,681–$1,710/sq ft range (excluding Chestnut, which came in at $1,547/sq ft on its larger 2,262-square-foot footprint). These four sales above $3M represent 9.3 percent of closings but 19.8 percent of total volume.
At the other end, two sales warrant attention precisely because they depart from the surrounding pattern. The 1,794-square-foot one-bedroom at 650 2nd Street #404 closed at $1,625,000 — a rate of $906/sq ft that sits below the median rate despite a sale price above the median. The one-bedroom at 701 Minna Street #6, at 1,173 square feet, recorded the month's lowest per-square-foot figure at $661, closing at $775,000.
Where the market split
With only one segment represented across all 43 closings, the split that matters is between price bands and bedroom counts.
By price band (all 43 closings, all condominiums):
| Band | Closings | Median $/Sq Ft |
|---|---|---|
| Under $1M | 10 | $963 |
| $1M–$1.5M | 10 | $1,189 |
| $1.5M–$2M | 15 | $1,288 |
| $2M–$3M | 4 | $1,488 |
| $3M–$5M | 4 | $1,695 |
The $1.5M–$2M band produced 15 closings — more than a third of the month — and its median rate of $1,288/sq ft sits above the overall median of $1,205/sq ft. The under-$1M band matched the $1M–$1.5M band at 10 closings each, but the per-square-foot gap between them ($963 vs. $1,189) reflects units that are either larger and older or in locations where price anchors lower.
The $2M–$3M band deserves a note: four sales, median rate $1,488/sq ft. The outlier within that band is 1035 Fell Street, a four-bedroom, 2,054-square-foot unit from 1905 that closed at $2,300,000 — $1,120/sq ft, well below its band peers. Its bedroom count (the only four-bedroom in the month's top 40) and square footage pull the rate down relative to the three smaller units sharing that band.
By segment: The data contains only condominiums. The single-segment table from the source is included for completeness.
| Segment | Closings | Median Price | Median $/Sq Ft | Median Sq Ft | Range |
|---|---|---|---|---|---|
| Condominium | 43 | $1,550,000 | $1,205 | 1,212 sq ft | $585K–$4.92M |
The per-square-foot spread within this single segment — from $661 to $2,280 — illustrates how wide the condominium category runs in San Francisco. A 1999-vintage one-bedroom in SoMa and a 2019-vintage three-bedroom high-rise tower unit share a legal classification but occupy different market positions entirely.
One further pattern in the roster: buildings with multiple closings in the same month. The 401 Harrison Street address appears twice — unit #26C at $1,995,000 (2 beds, 1,334 sq ft, $1,496/sq ft) and unit #37G at $1,115,000 (1 bed, 758 sq ft, $1,471/sq ft). Both closed in the same building, at nearly identical per-square-foot rates despite a $880,000 gap in price, suggesting size rather than rate is doing the work there.
Across the period
The data contains closings only for September 2026. The "Q3 2026" label in the source reflects the period designation, but the transaction record covers only the final month of the quarter.
| Month | Closings | Median Price | Median $/Sq Ft |
|---|---|---|---|
| September 2026 | 43 | $1,550,000 | $1,205 |
| July 2026 | — | — | — |
| August 2026 | — | — | — |
With only one month of data in the record, no directional trend within the quarter can be drawn. The month-by-month table reflects what the source provides.
What it means
For sellers considering listing: The September record shows 43 condominiums closed across a price range from $585,000 to $4,922,000. The $1.5M–$2M band produced the most closings (15), and the median rate across all 43 sales was $1,205 per square foot. The four sales above $3M cleared at rates between $1,547 and $1,763 per square foot. No list-price data is available for the period, so the relationship between asking and closing figures cannot be assessed from this record.
For buyers evaluating timing: The month's 43 closings show a wide distribution, with 20 sales at or below the $1,550,000 median and 10 at or below $1M. The per-square-foot rate in the under-$1M band (median $963/sq ft across 10 sales) sits meaningfully below the overall median, reflecting smaller units or older stock — the composition behind the number matters. No days-on-market data was recorded for any closing in this period, so how long units sat before closing is not available in this record.
For owners not transacting: The 43 September closings establish a reference range for the condominium segment. The median of $1,550,000 across 1,212 median square feet at $1,205/sq ft represents one month of MLS-recorded activity. The high at $4,922,000 and the per-square-foot ceiling of $2,280 are both set by the 488 Folsom tower closing; the floor of $585,000 represents a sale not in the top-40 roster. Building type, size, location, and vintage all moved the per-square-foot figure substantially within a single legal segment in a single month.
Tim McMullen · CA DRE #02016832
[email protected] · (415) 691-9272
Tim McMullen, CA DRE #02016832. Real estate services provided by Tim McMullen, Broker, CA DRE #02016832. Figures are from recorded sales; nothing here is an opinion of the value of any home.