The Rockwell.
Every unit here is open to an offer — listed or not.
Make an offer on any unit →See every sale in this building — freeA unit lists, a sale records, the HOA figures change. No account, and one click to stop.
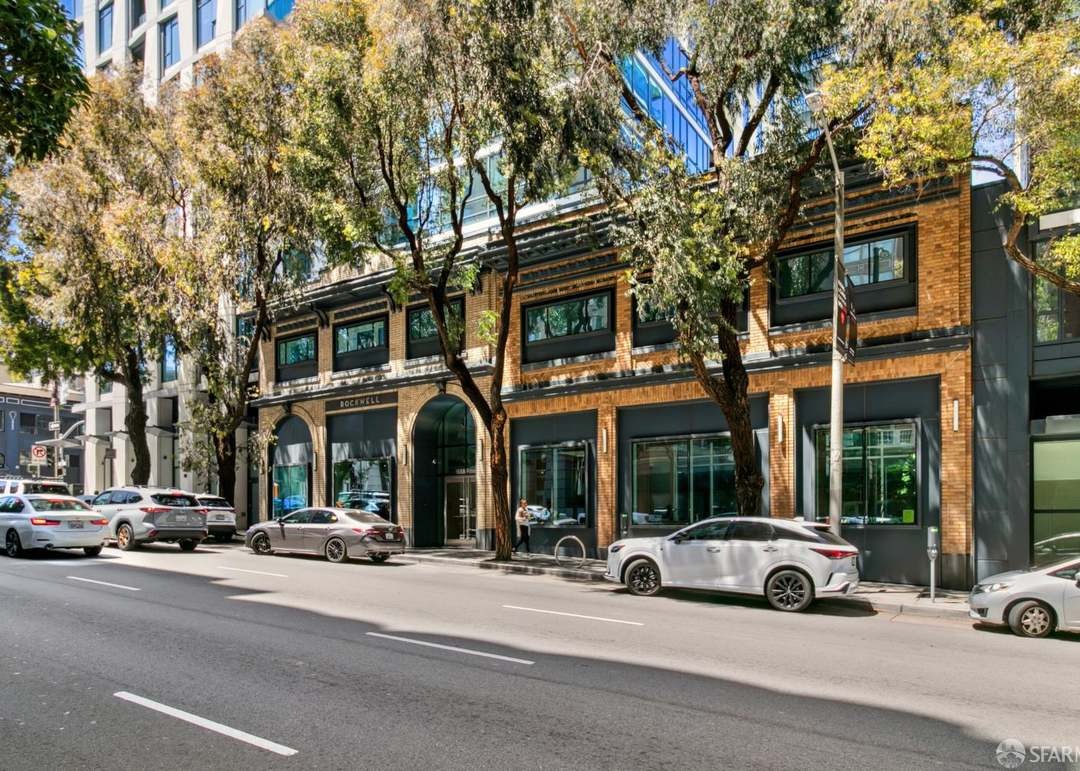
The Rockwell, a mile from the nearest AI lease: eight sales this year, two-bedrooms at $1,519 a foot, and the median listing still selling in 16 days
Eight closings at 1688 Pine through October 15, against 13 in the 2025 window. Median price per square foot is $1,260 against $1,243; the building's 2020 high was $1,394. Two-bedrooms went from $1,314 to $1,519 a foot. Three paired resales split two down, one up.
See condos before they reach the listing sites.
Coming-soon listings, owners’ private numbers and the Investor Exchange, with the unit, price and photos of each. Nothing in The Rockwell is off market today; a free account shows you everything that is.
The building
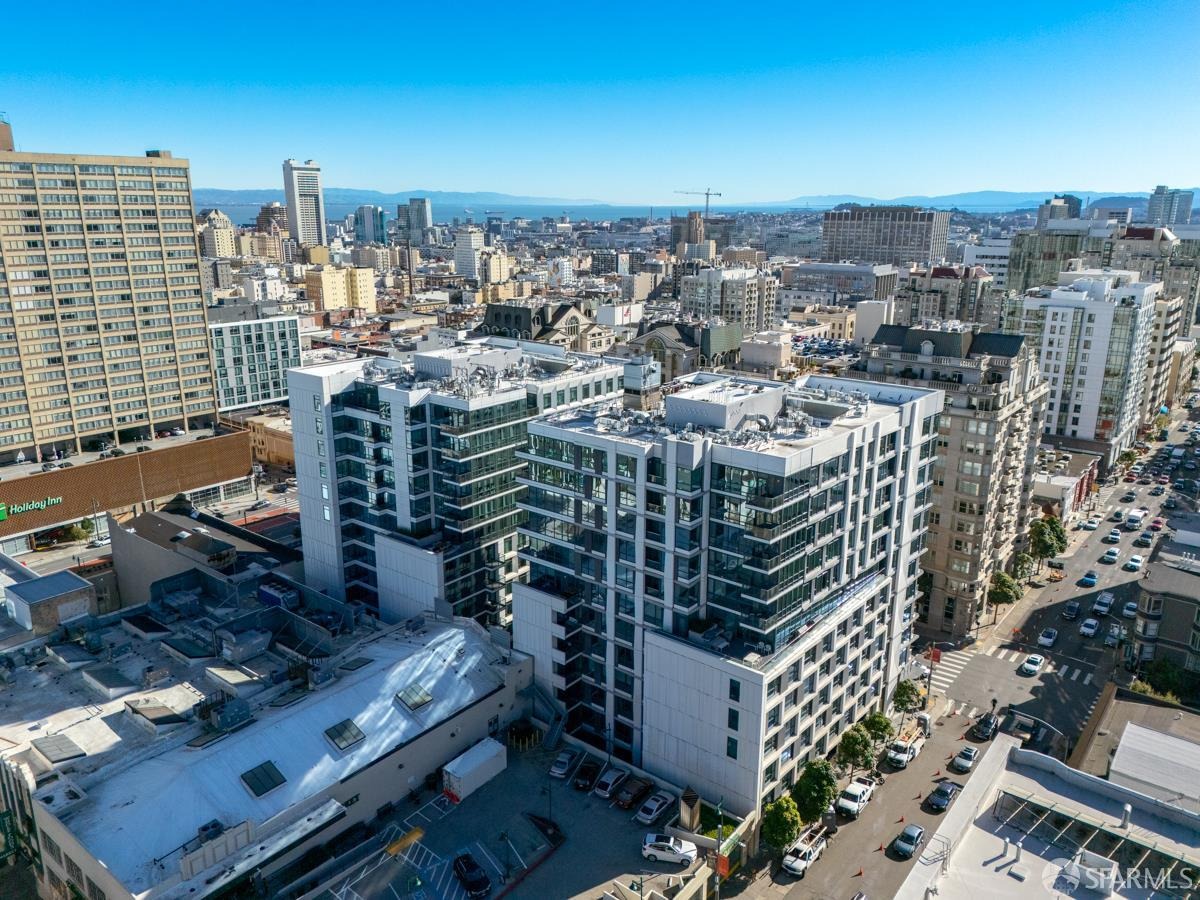
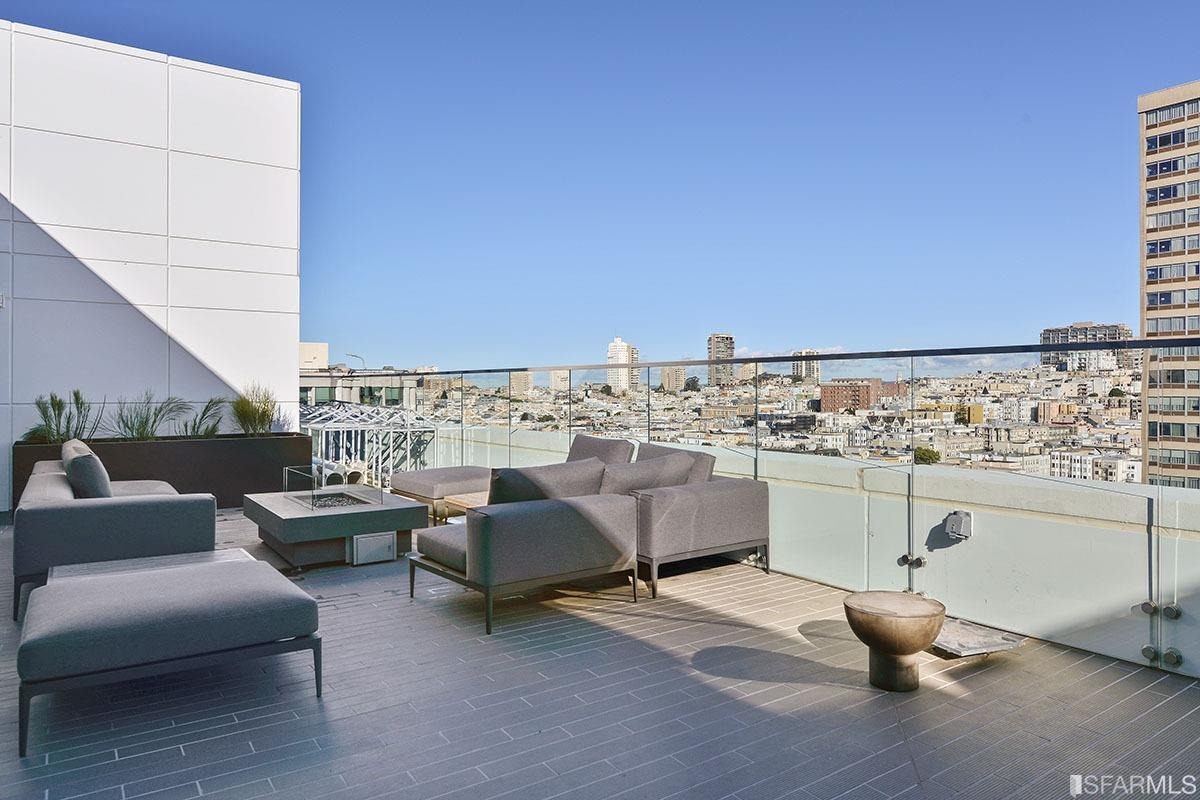
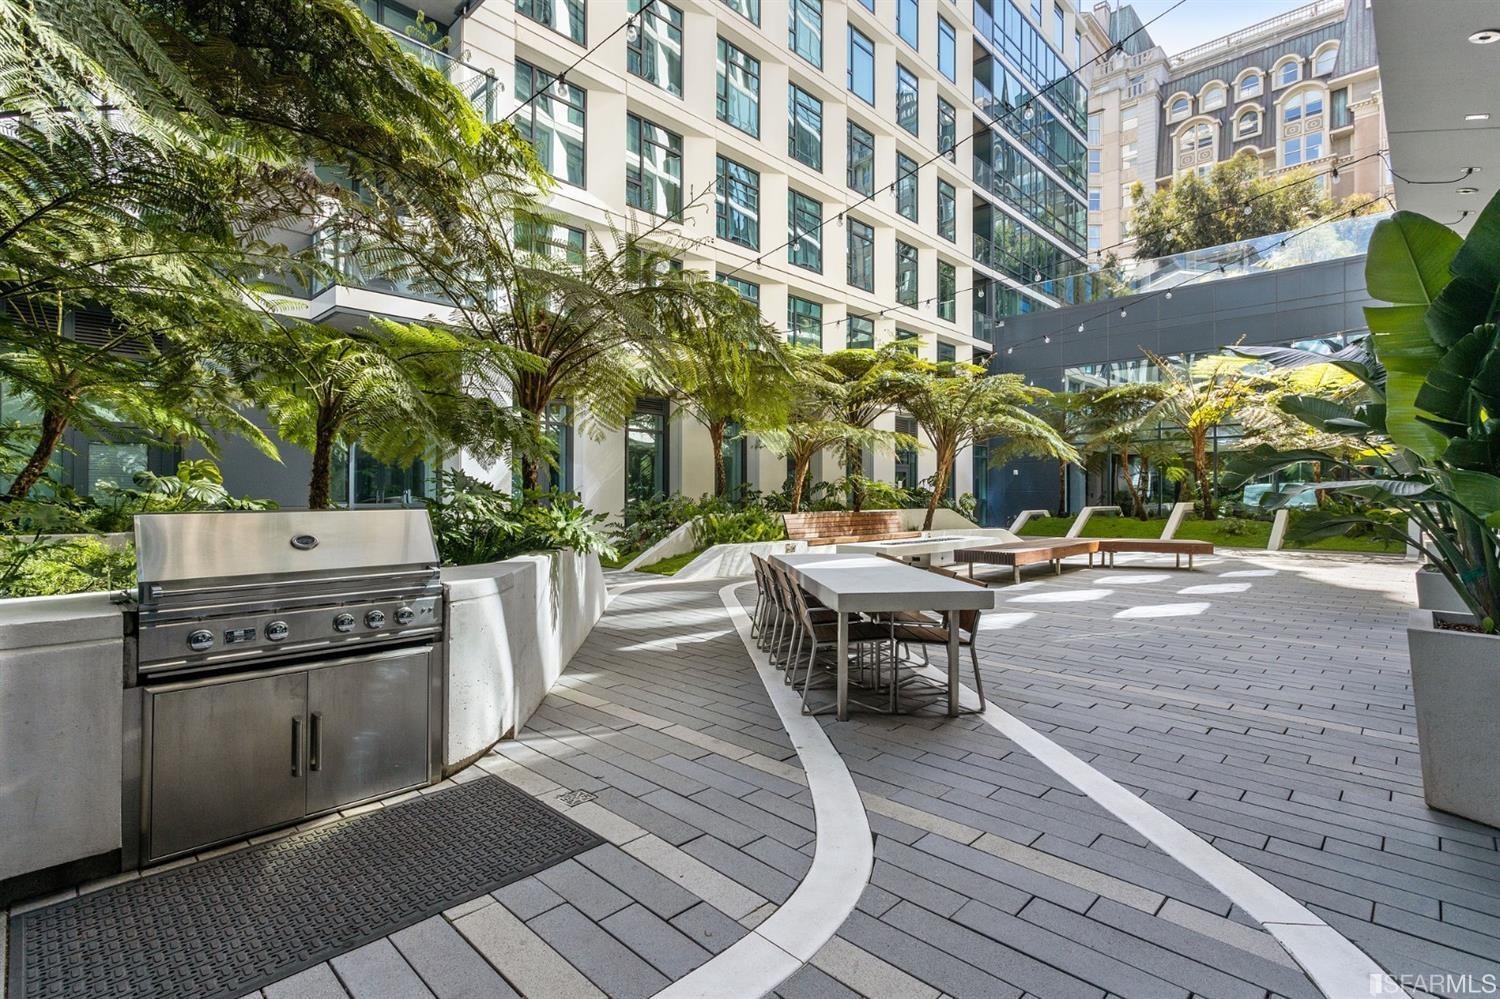
A visual survey of The Rockwell.
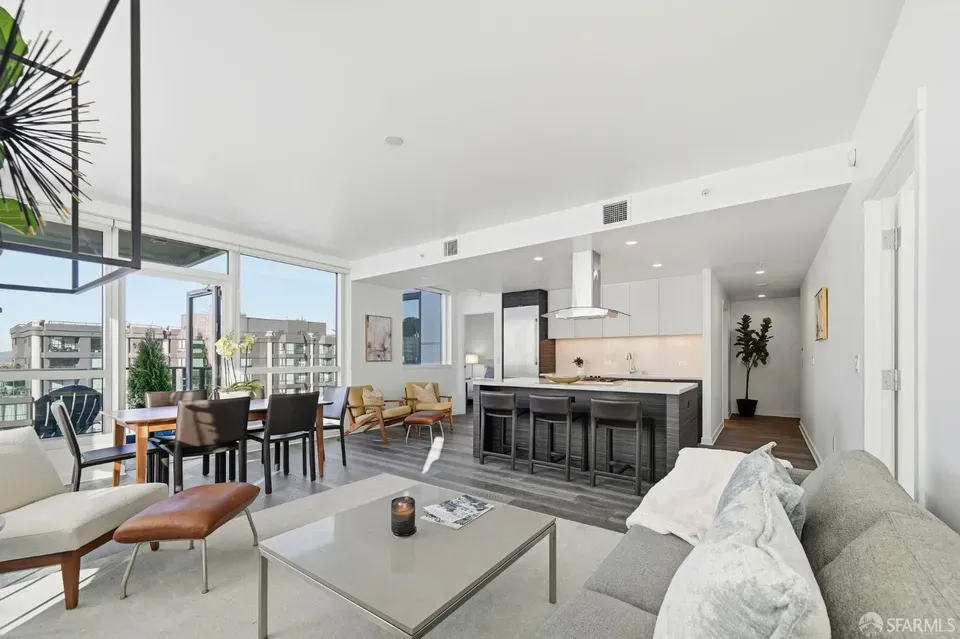
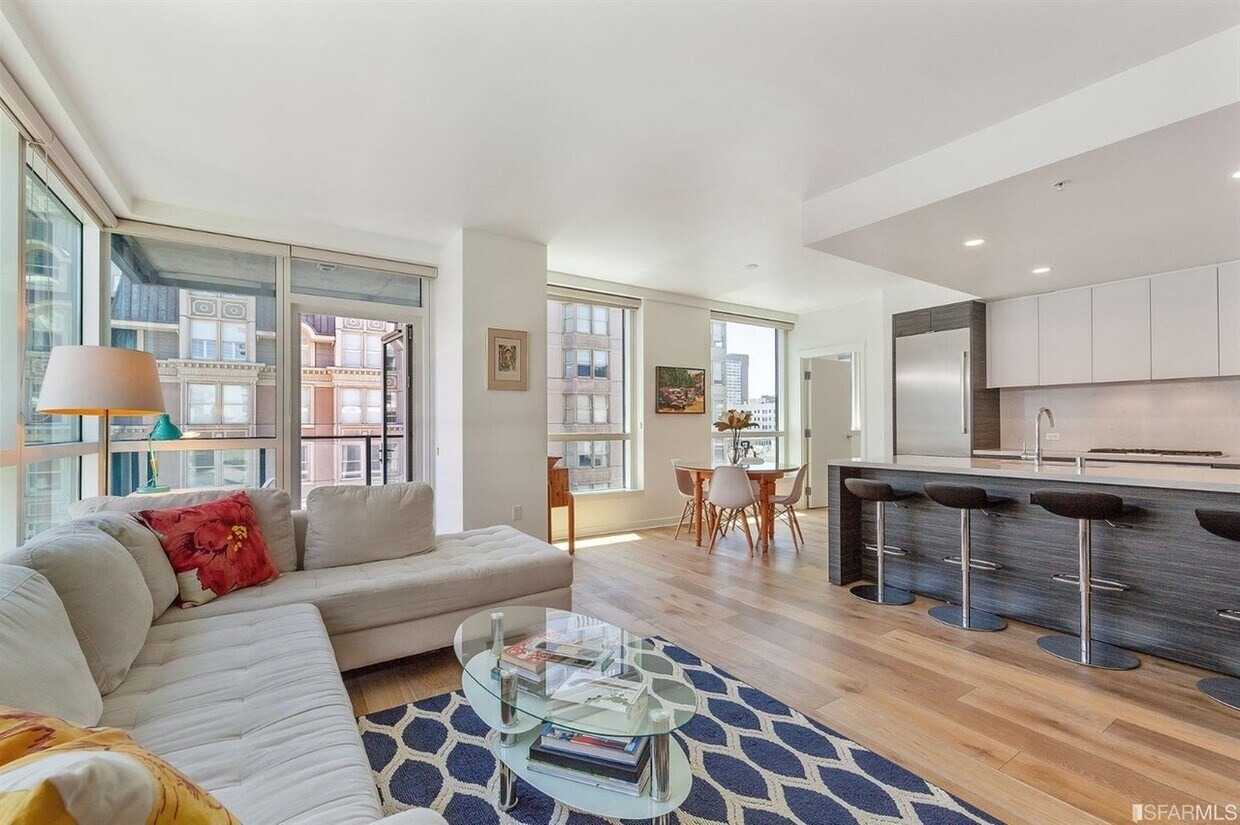
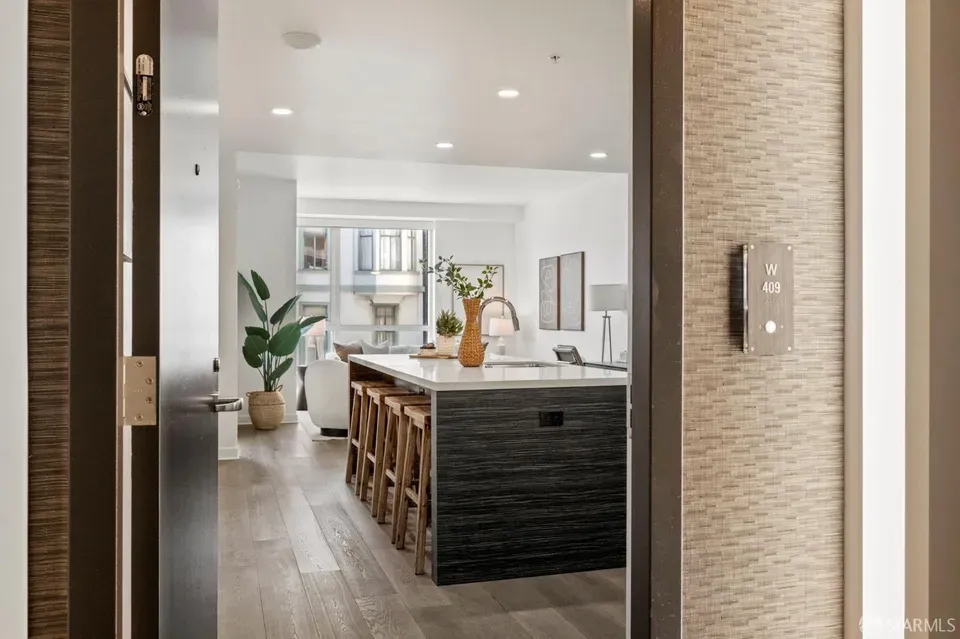
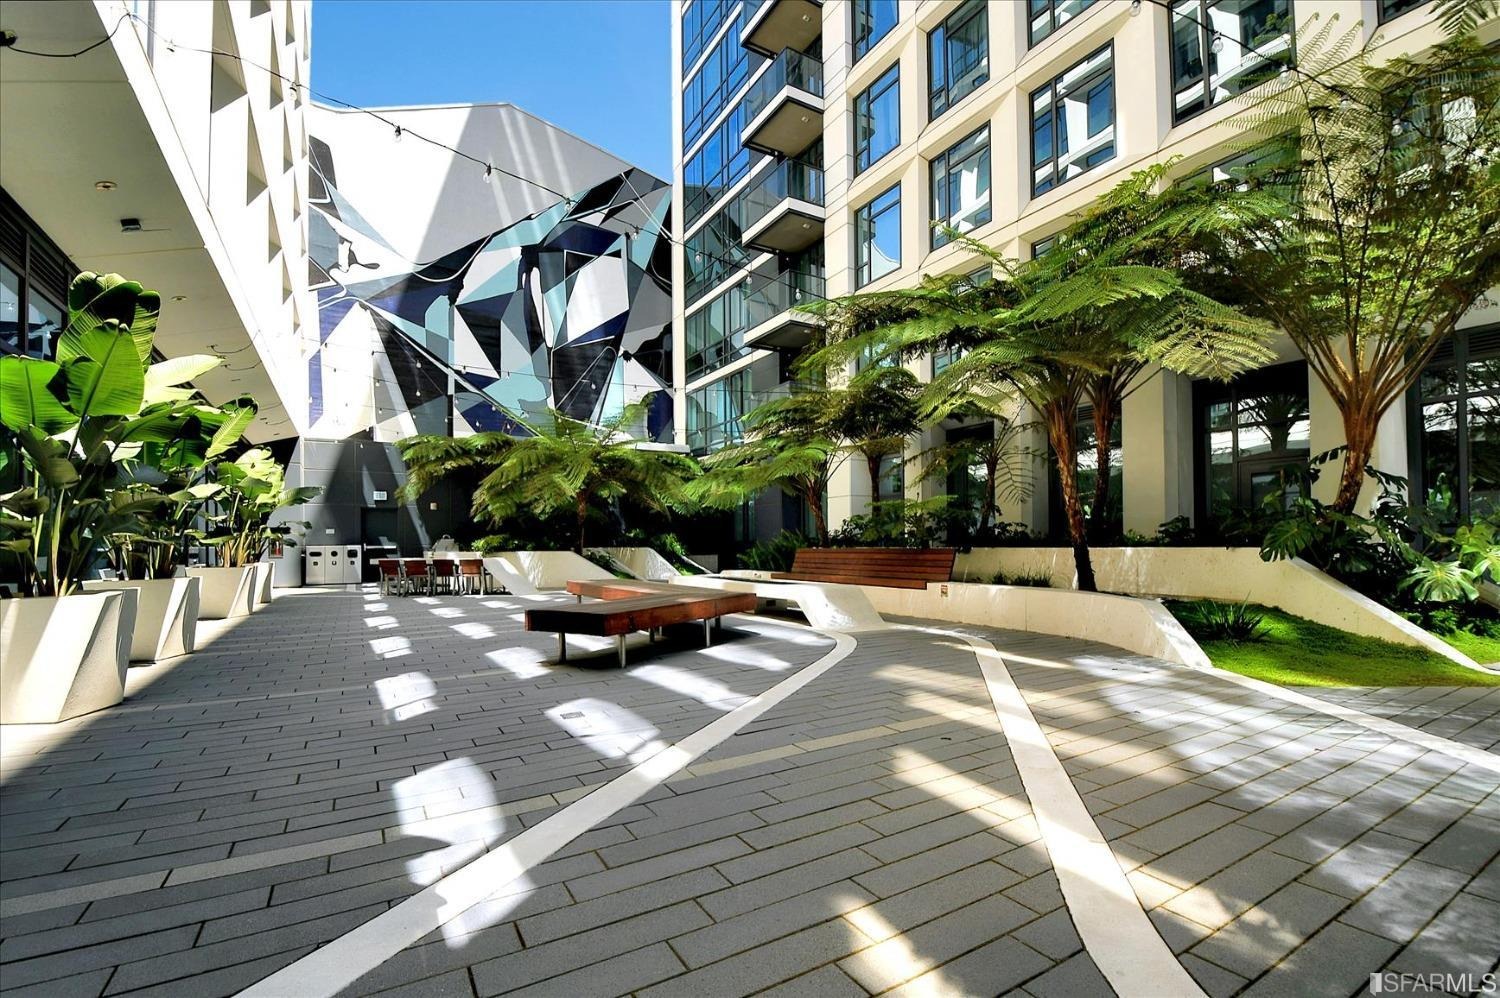
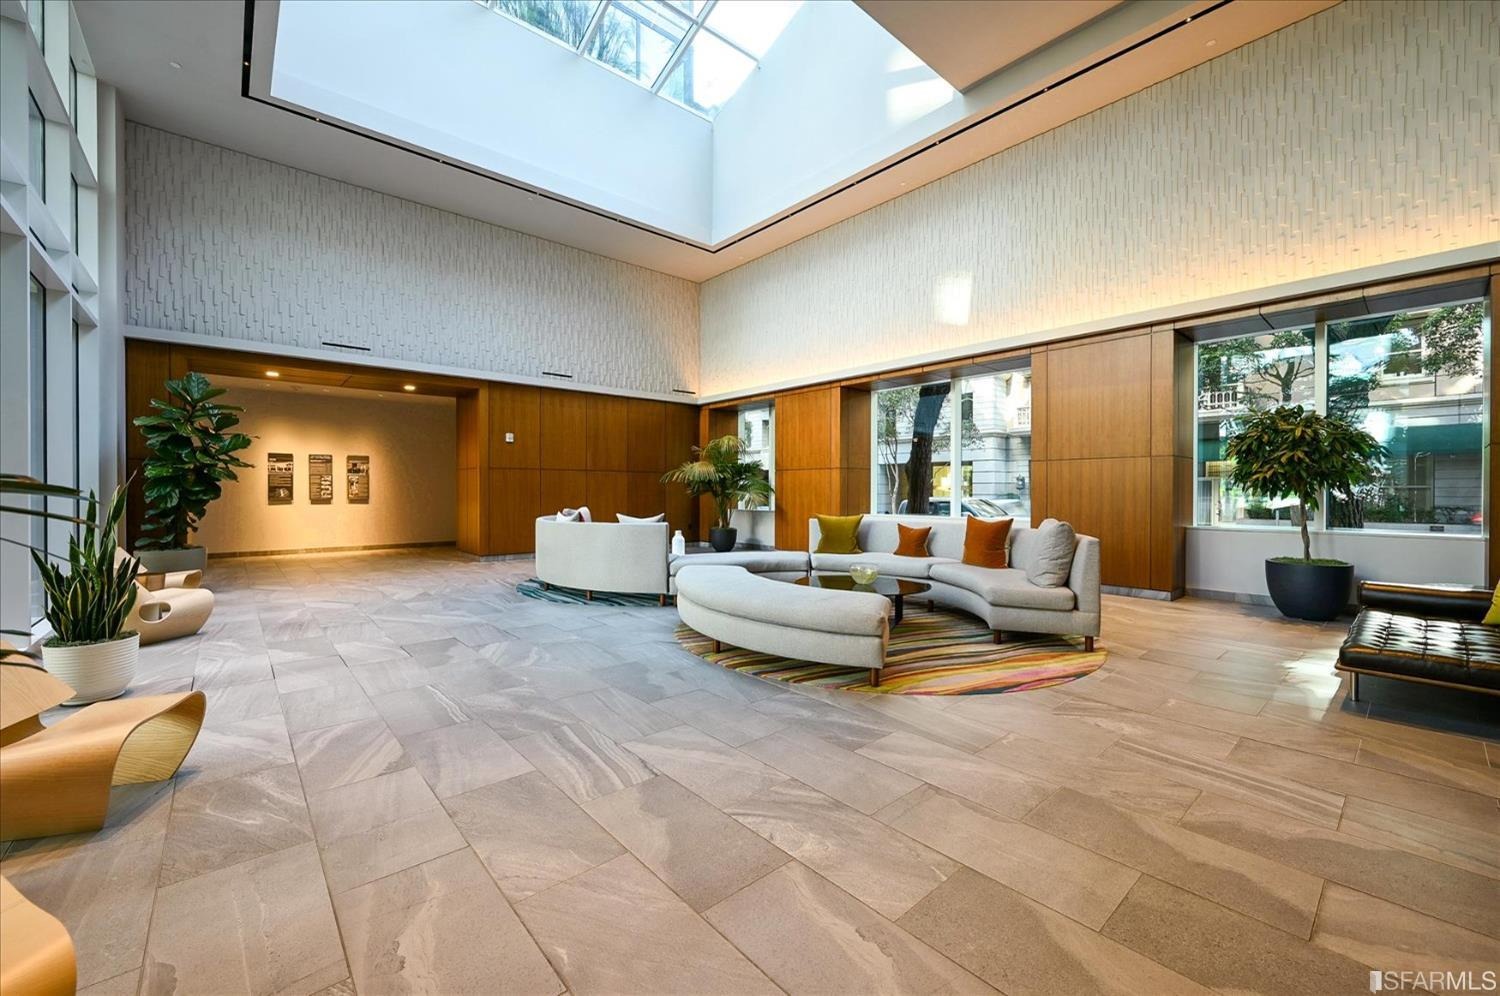
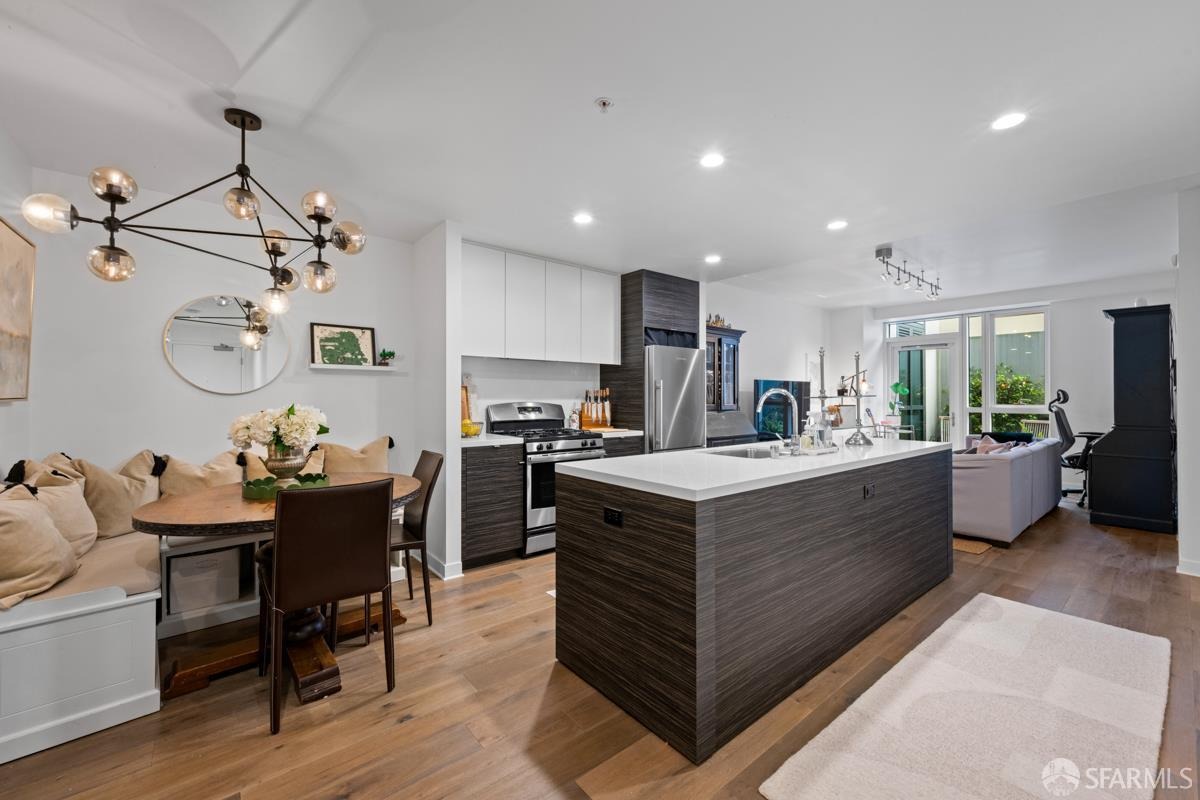
About The Rockwell
The Rockwell is a 259-unit condominium building in Pacific Heights, San Francisco, built in 2016. 4 recorded sales in the 12 months to Oct 17, 2026, too few for a median.
The Rockwell, by the numbers
Sign in to see the full dossier
Owner tenure patterns, price trajectories, sale-to-list ratios and off-market activity signals — available to members. Free to sign up.
Unlock enhanced data →Every recorded sale at The Rockwell
The Rockwell at 1688 Pine St has 201 recorded sales since 2016. In the 12 months to Oct 17, 2026, 4 sold, too few for a median. Median time on market: 16 days (8 MLS sales, same 12 months).
| Date | Unit | Price | Sq ft | $/sq ft |
|---|---|---|---|---|
| Mar 27, 2026 | 409 | $875,000 | 720 | $1,215 |
| Feb 19, 2026 | 502 | $1,310,000 | 1,040 | $1,260 |
| Dec 3, 2025 | 402 | $1,050,000 | 1,040 | $1,010 |
| Oct 17, 2025 | 707 | $1,565,000 | 1,164 | $1,345 |
| Sep 18, 2025 | 4 | $1,500,000 | 972 | $1,543 |
| Aug 28, 2025 | 1203 | $873,000 | 673 | $1,297 |
| Jun 26, 2025 | 709 | $770,000 | 639 | $1,205 |
| May 12, 2025 | 1209 | $840,000 | 676 | $1,243 |
| Mar 18, 2025 | 802 | $1,418,000 | 957 | $1,482 |
| Mar 10, 2025 | 711 | $1,100,000 | 924 | $1,190 |
| Dec 17, 2024 | 601 | $1,040,000 | 889 | $1,170 |
| Oct 13, 2024 | W902 | $1,350,000 | 955 | $1,414 |
| Oct 1, 2024 | W709 | $860,000 | 717 | $1,199 |
| Sep 25, 2024 | 1208 | $1,300,000 | 1,068 | $1,217 |
| May 14, 2024 | 1206 | $1,535,000 | 1,150 | $1,335 |
The 15 most recent of 201 recorded sales, from county records and the MLS, one row per sale. Transfers under $100,000 are left out. BMR marks a below-market-rate sale: it is listed here and left out of every figure on this site.
Sale history by unit
149 units at The Rockwell have a recorded sale since 2016. Each page lists that unit’s recorded sales and the units directly above and below it.
All 149 units with a recorded sale since 2016
More on The Rockwell
How The Rockwell compares
Trailing-12-month performance against the half-mile surroundings and the broader market, plus quarter-by-quarter $/ft² history.
Pacific Heights, by $/sf
Median price per square foot across Pacific Heights buildings — last 12 months of closed sales. The Rockwell is highlighted.
Mortgage calculator
Back-of-envelope monthly cost for a purchase at The Rockwell. Defaults use the building’s recent median price and conservative market assumptions.
Numbers add up?
Make this offer · $950,000 →Buy at or sell at The Rockwell
You don’t need a unit to be listed to make a move. Submit an offer on any unit in the building, or name a price your own unit would sell for.
Buy — submit an offer
Name the unit, the price, and your terms. We route it to the owner through standard channels and track the response in your dashboard.
Make an offer →Sell — name your price
Set a Make-Me-Move number, not a listing. Keep living in your unit. We notify you only when a buyer’s offer matches your number.
Set your price →All offers require a free account. Already have one? Sign in.
Get the inside view on The Rockwell
Three ways to learn more — no account required. Tell us where to send it and it’s on its way.
Watch the market review
A short video walkthrough of recent sales in The Rockwell and the buildings around it — what’s moving, and what it means for value.
HOA & CC&R cheat sheet
A plain-English summary of The Rockwell’s rules, fees, rental policy, and the fine print that actually matters — delivered within 24 hours.
Talk it through with Tim
Ready to go deeper? Grab a time directly — or leave your email and Tim will reach out.